Every year, I evaluate the top 15 MBA programs and dissect the class profile. The numbers reveal an applicant’s chances of admission to these prestigious programs.
Don’t look at the entry criteria as just a hurdle to overcome.
GMAT/GRE are certainly the hurdles.
Applicants miss the most important class profile data while shortlisting their top 5 or top 7 MBA programs – the Pre-MBA industry and undergraduate degree numbers.
For the top 15 MBA Class profile analysis for the Class of 2027, I cover:
Contents
GMAT Scores
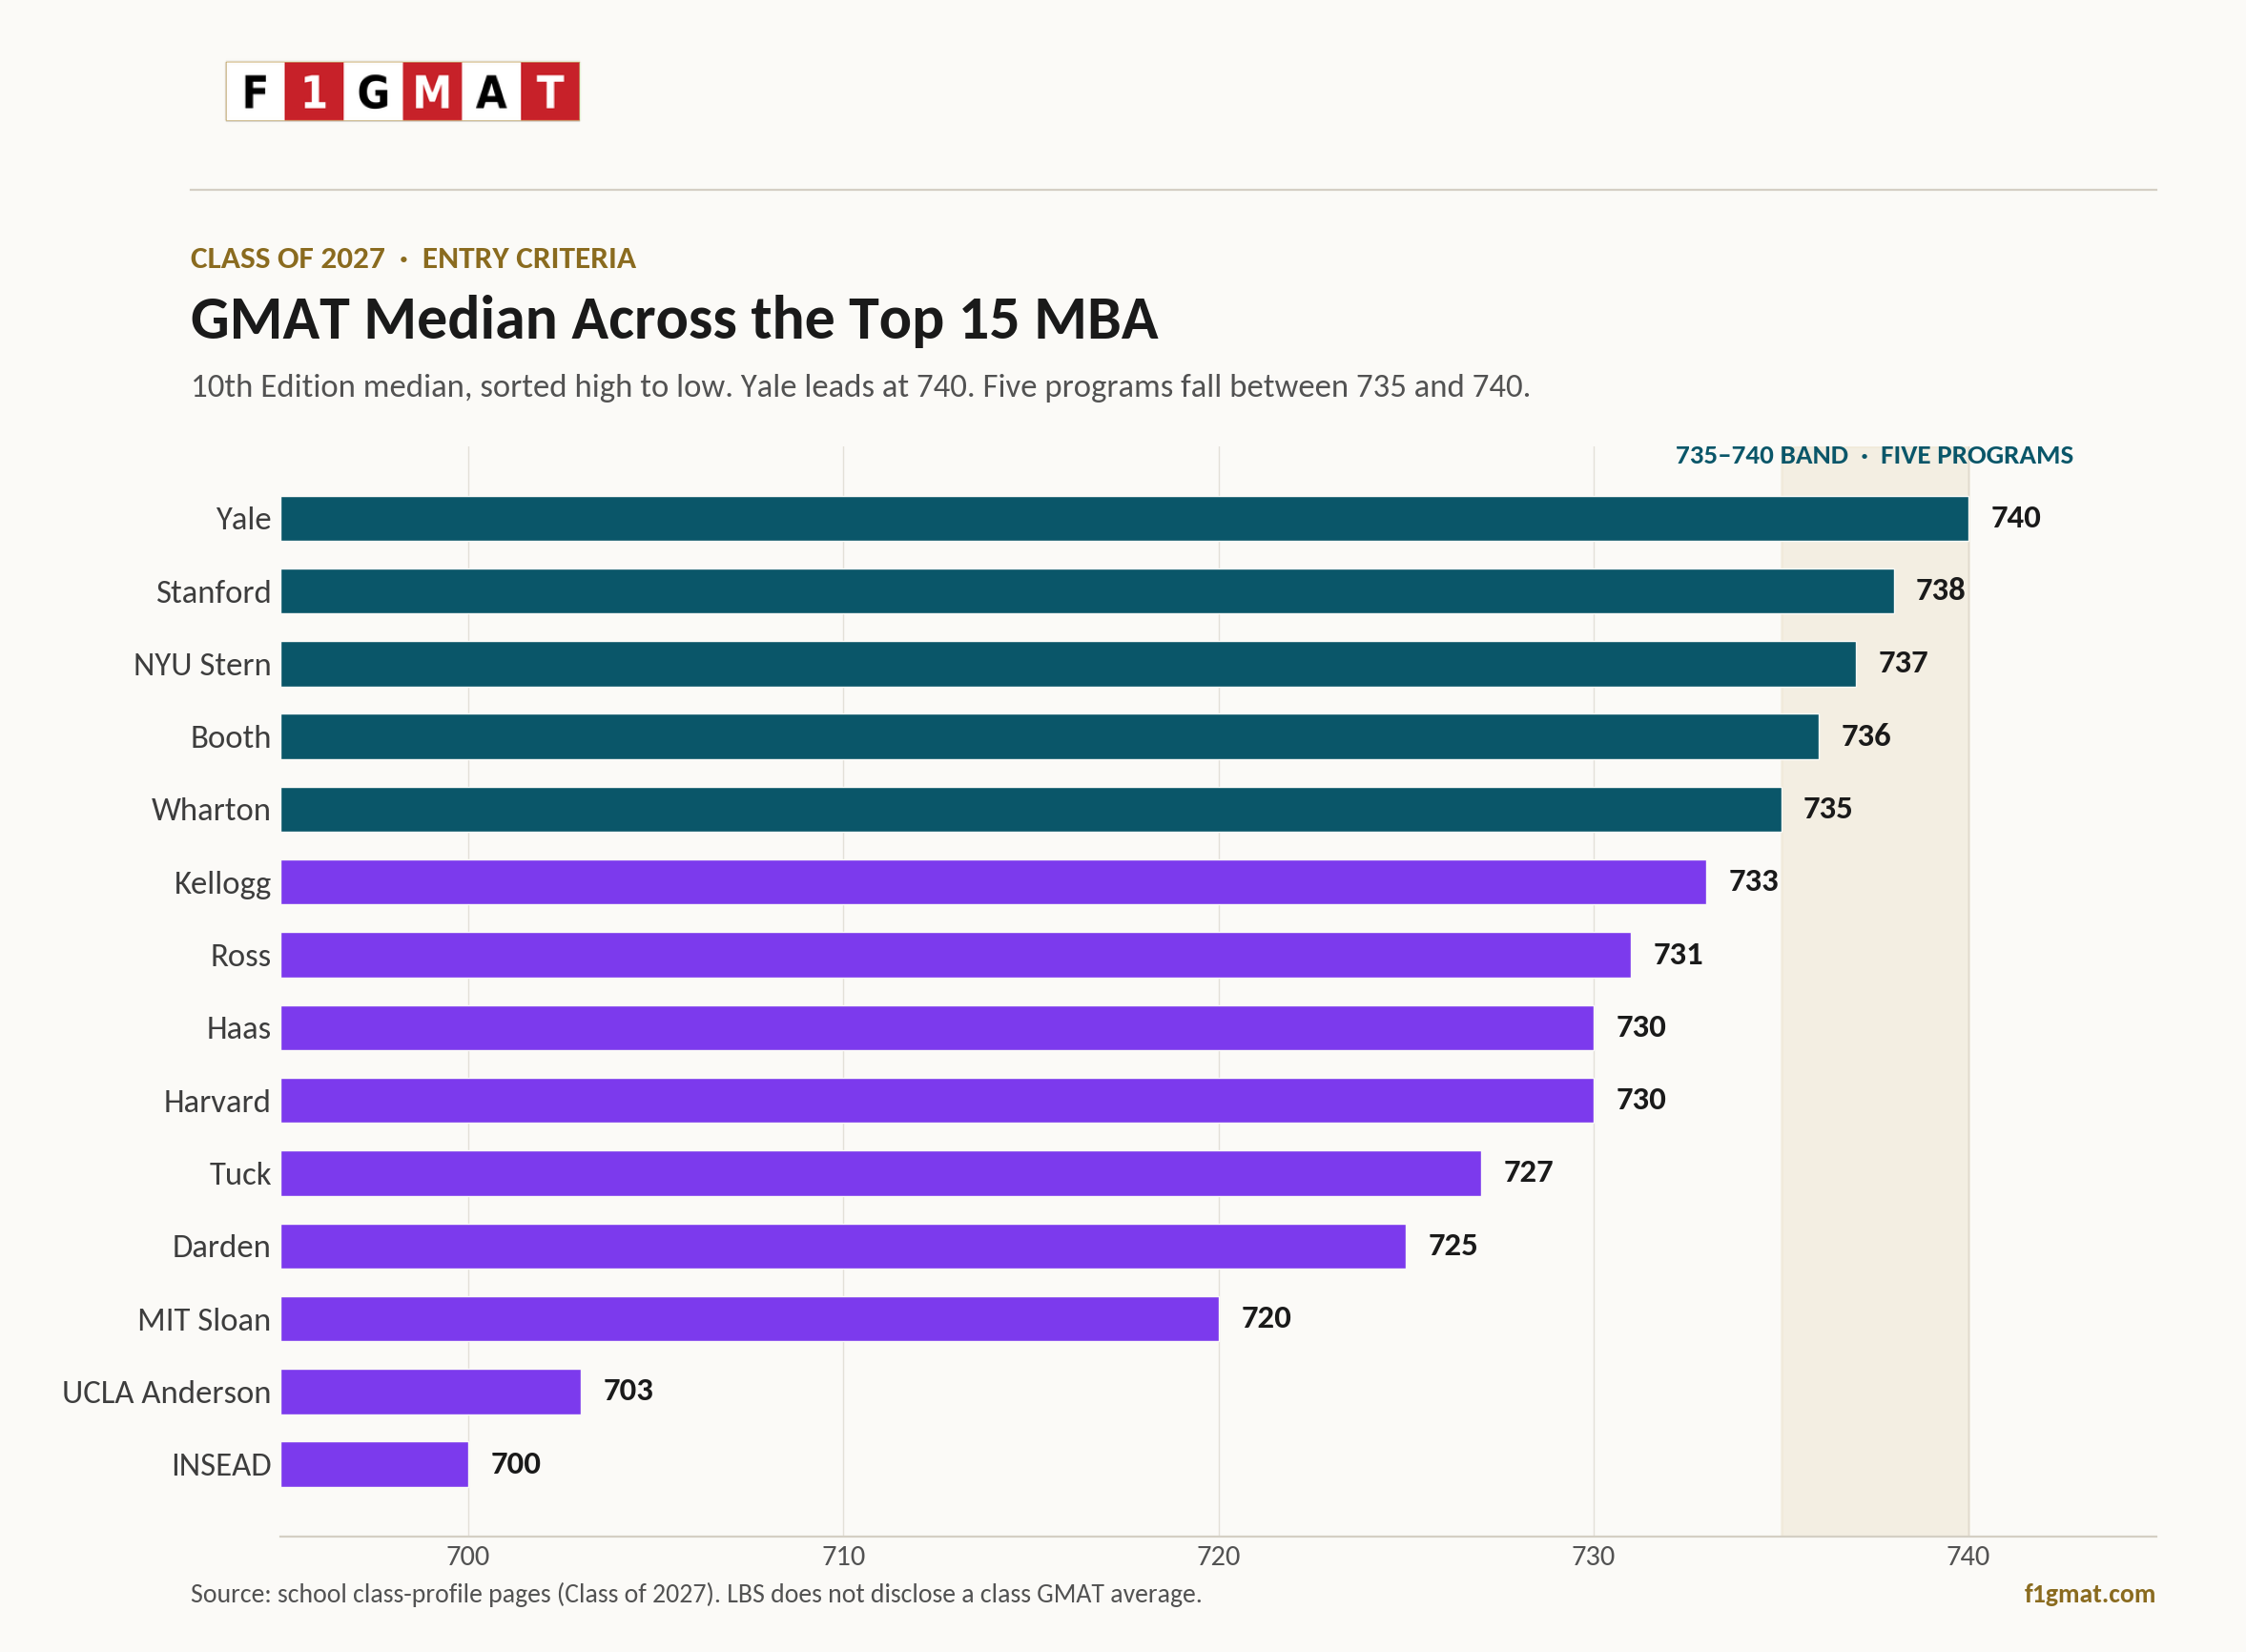
Yale leads the Top 15 MBA on median GMAT (10th Edition) at 740, matching its own school record and featuring two points ahead of Stanford and ten above Harvard.
Stanford held its average at 738, the second-highest score in the group and one point ahead of NYU Stern.
NYU Stern set a school record at 737, and Booth and Wharton each matched school records at 736 and 735, which packs five top MBA programs into the six-point band from 735 to 740.
Harvard, which historically posted the highest median in this group, dropped to 730 for the Class of 2027 after more candidates submitted the GMAT Focus Edition. This shorter exam replaced the 10th Edition, which carries a mean of 685 at Harvard.
Highest GMAT Focus Edition Score
Kellogg matched its own record at 733 (10th Edition) and posted a Focus average of 687, one of the highest Focus figures among the M7 programs.
Ross climbed to 731, its strongest GMAT showing in this group.
Haas held its 730 median, level with Harvard and MIT Sloan, which reports the median rather than the average, posting 720 (10th Edition) with a Focus median of 675.
Yale’s Focus figure is also at 675, tied with MIT Sloan and Haas - mid-pack ranking among the group’s Focus scores, below Stanford’s 689 and Kellogg’s 687.
Tuck held at 727 and Darden at 725 on the 10th Edition, each with a Focus figure of 671.
UCLA Anderson averaged 703 and INSEAD 700, the two lowest averages the group reports.
London Business School does not disclose its class’s average GMAT score.
Our research shows that it is near 645 on the Focus Edition.
GRE Scores
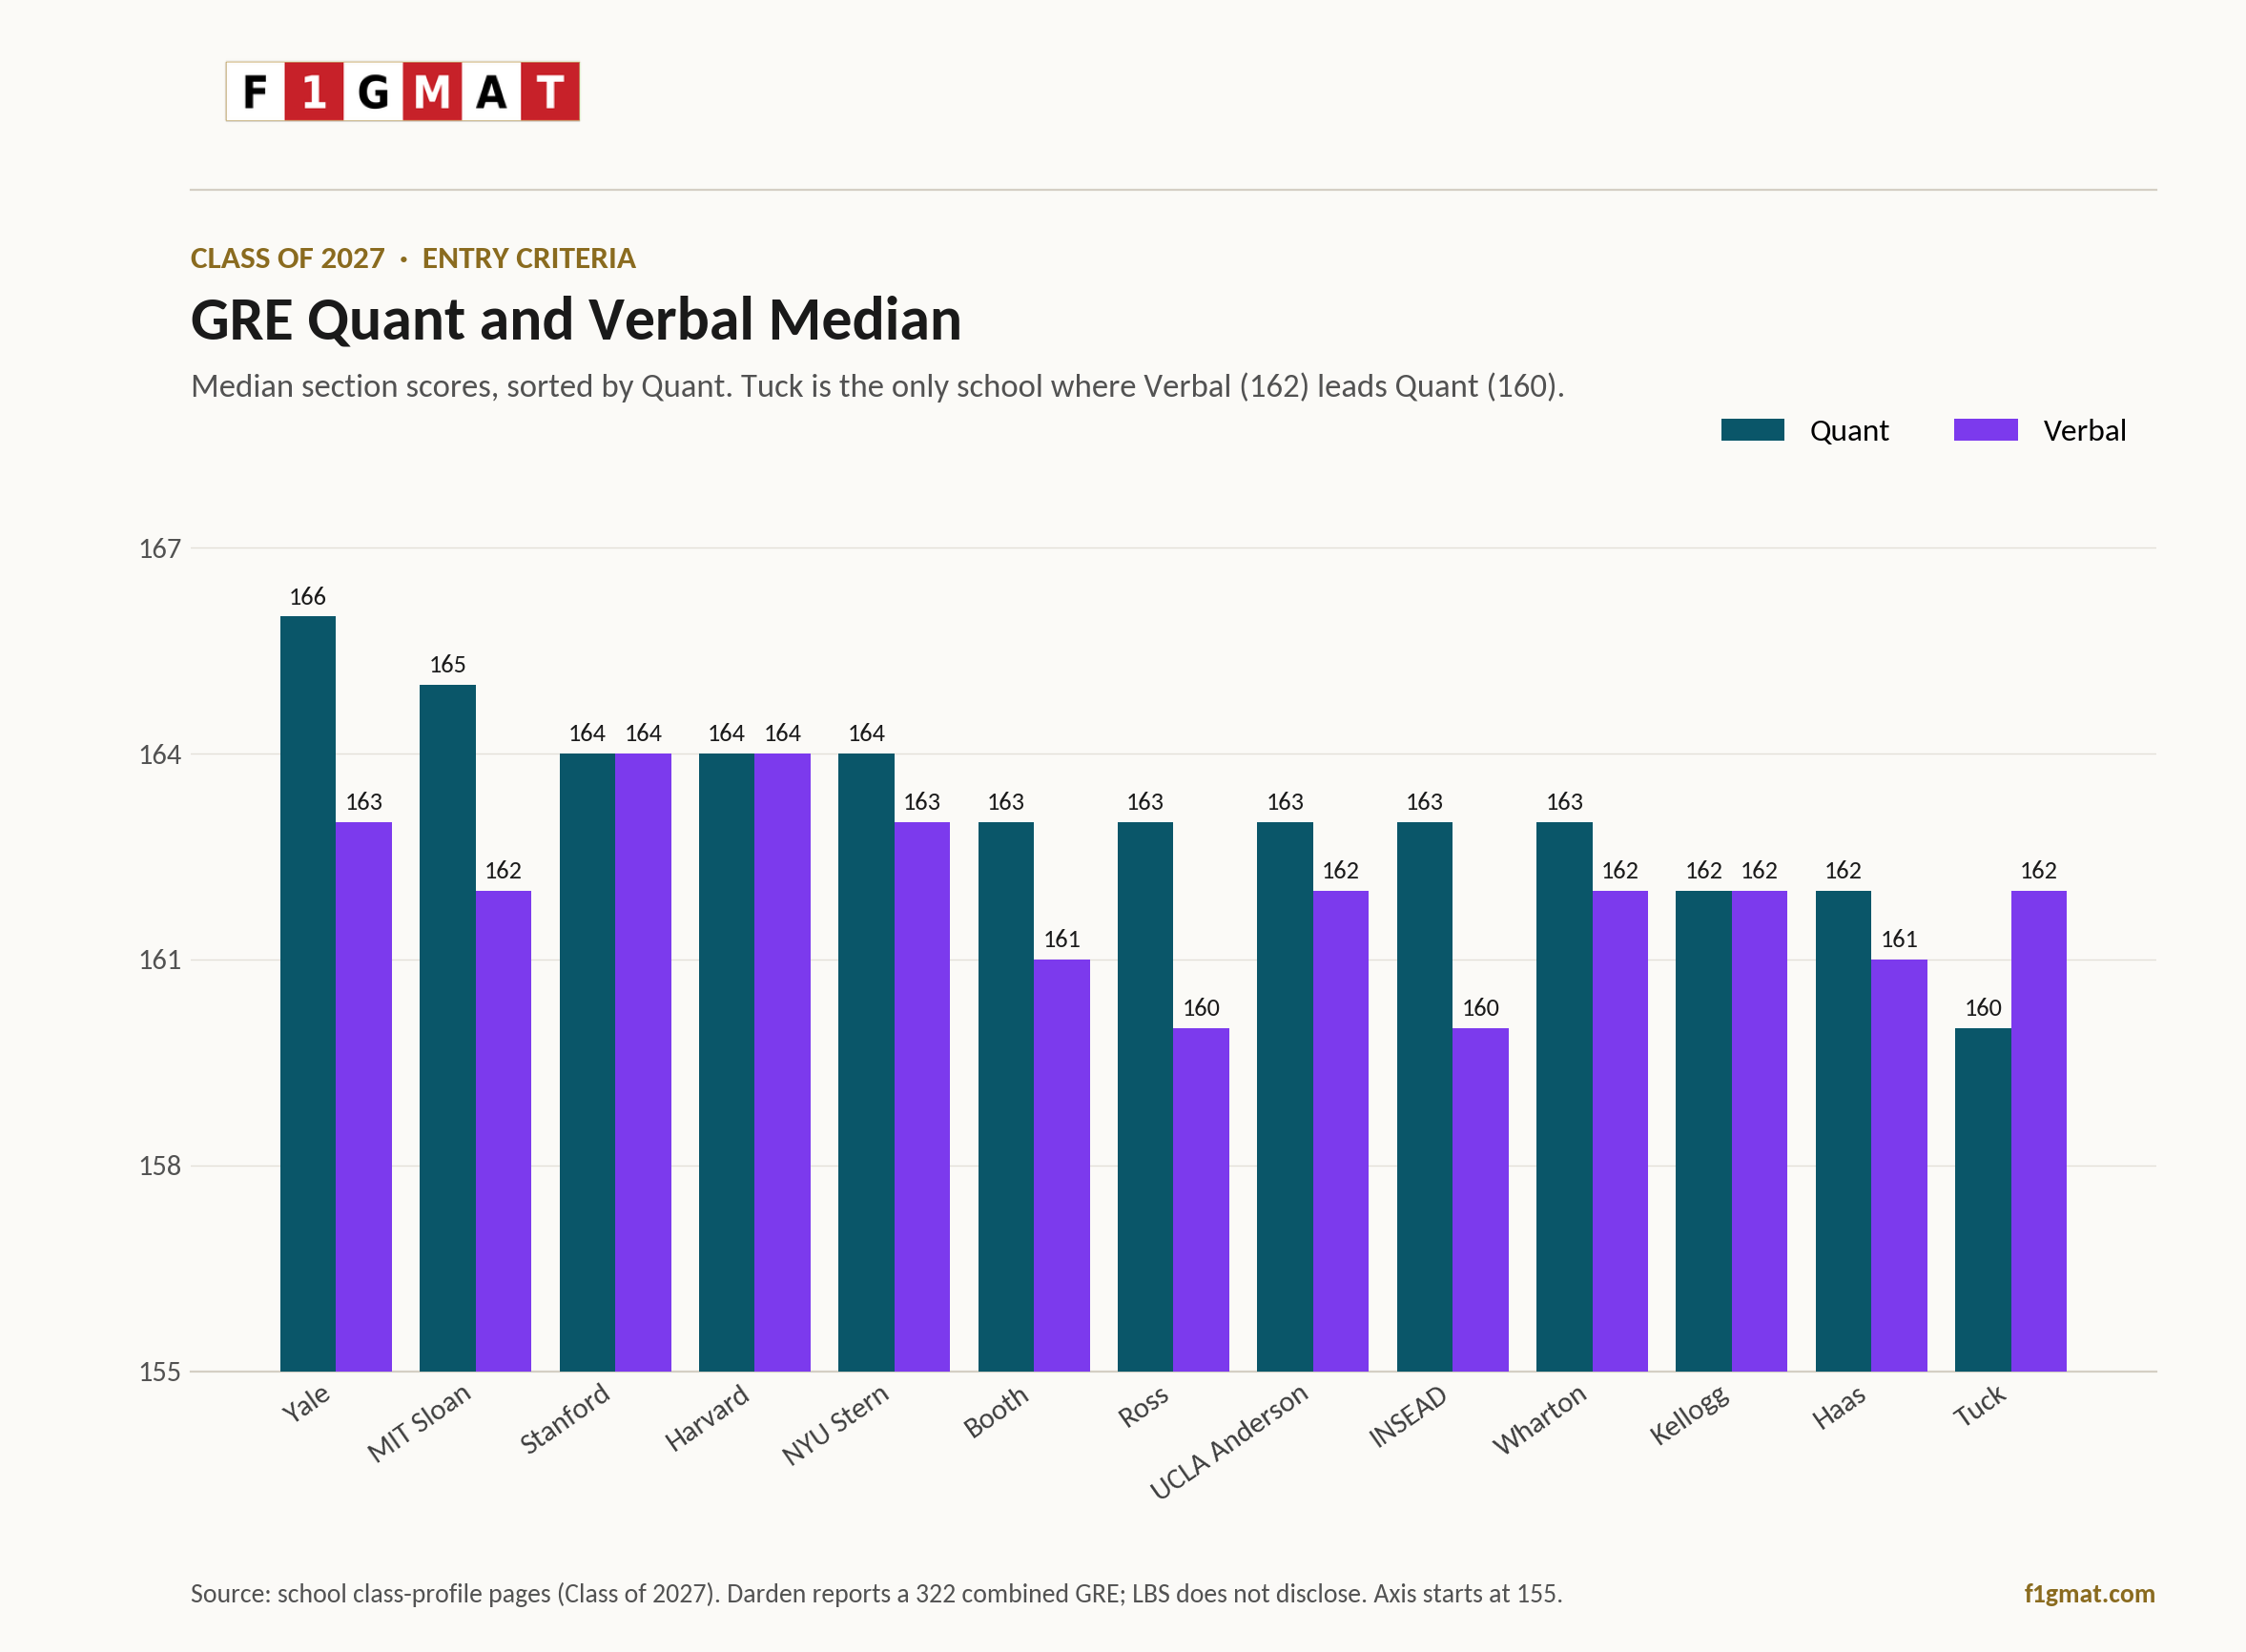
Yale again had the highest Quant median GRE score in the Top 15 MBA program ranking at 166, complemented by a Verbal median of 163. Stanford and Harvard each reported Quant and Verbal averages of 164/164, the only two schools in the group with no gap between the two sections.
NYU Stern follows at 164/163 and UCLA Anderson at 163/162, while MIT Sloan reported a Quant median of 165 against a Verbal median of 162.
Booth, Wharton, and Kellogg scores in a 162 to 163 Quant range with Verbal medians of 161 to 162.
Ross and Haas reported the lowest Quant and Verbal scores in the US peer group, at 163/160 and 162/161, respectively, again correlating with the international student percentage both school attracts (40 for Ross and 44% for Haas)
Tuck - Verbal GRE Overshadows Quant GRE
Tuck is the only Top 15 school with a Verbal median (162) above its Quant median (160), an inverse logic on its international peer group (34% international)
Darden disclosed a combined GRE average of 322 rather than section medians, and INSEAD revealed a 163 Quant and 160 Verbal. For INSEAD, the 3-campus structure favors international candidates with strong quant orientation and a relative weak verbal score.
London Business School did not release its school-level GRE averages, which we assume would reveal the low GRE verbal score.
| Top 15 MBA | GMAT | GRE (Q/V) |
|---|---|---|
| Stanford | 738 (Focus 689) | 164/164 |
| MIT Sloan | 720 (Focus 675) | 165/162 |
| Harvard | 730 (Focus 685) | 164/164 |
| Wharton | 735 (Focus 676) | 163/162 |
| Booth | 736 (Focus 670) | 163/161 |
| Kellogg | 733 (Focus 687) | 162/162 |
| Tuck | 727 (Focus 671) | 160/162 |
| Yale | 740 (Focus 675) | 166/163 |
| Darden | 725 (Focus 671) | 322 (combined) |
| NYU Stern | 737 (Focus 682) | 164/163 |
| Ross | 731 (Focus 681) | 163/160 |
| Haas | 730 (Focus 675) | 162/161 |
| LBS | Not disclosed | Not disclosed |
| INSEAD | 700 | 163/160 |
| UCLA Anderson | 703 | 163/162 |
Top 15 MBA Class Profile: International & Women Percentage
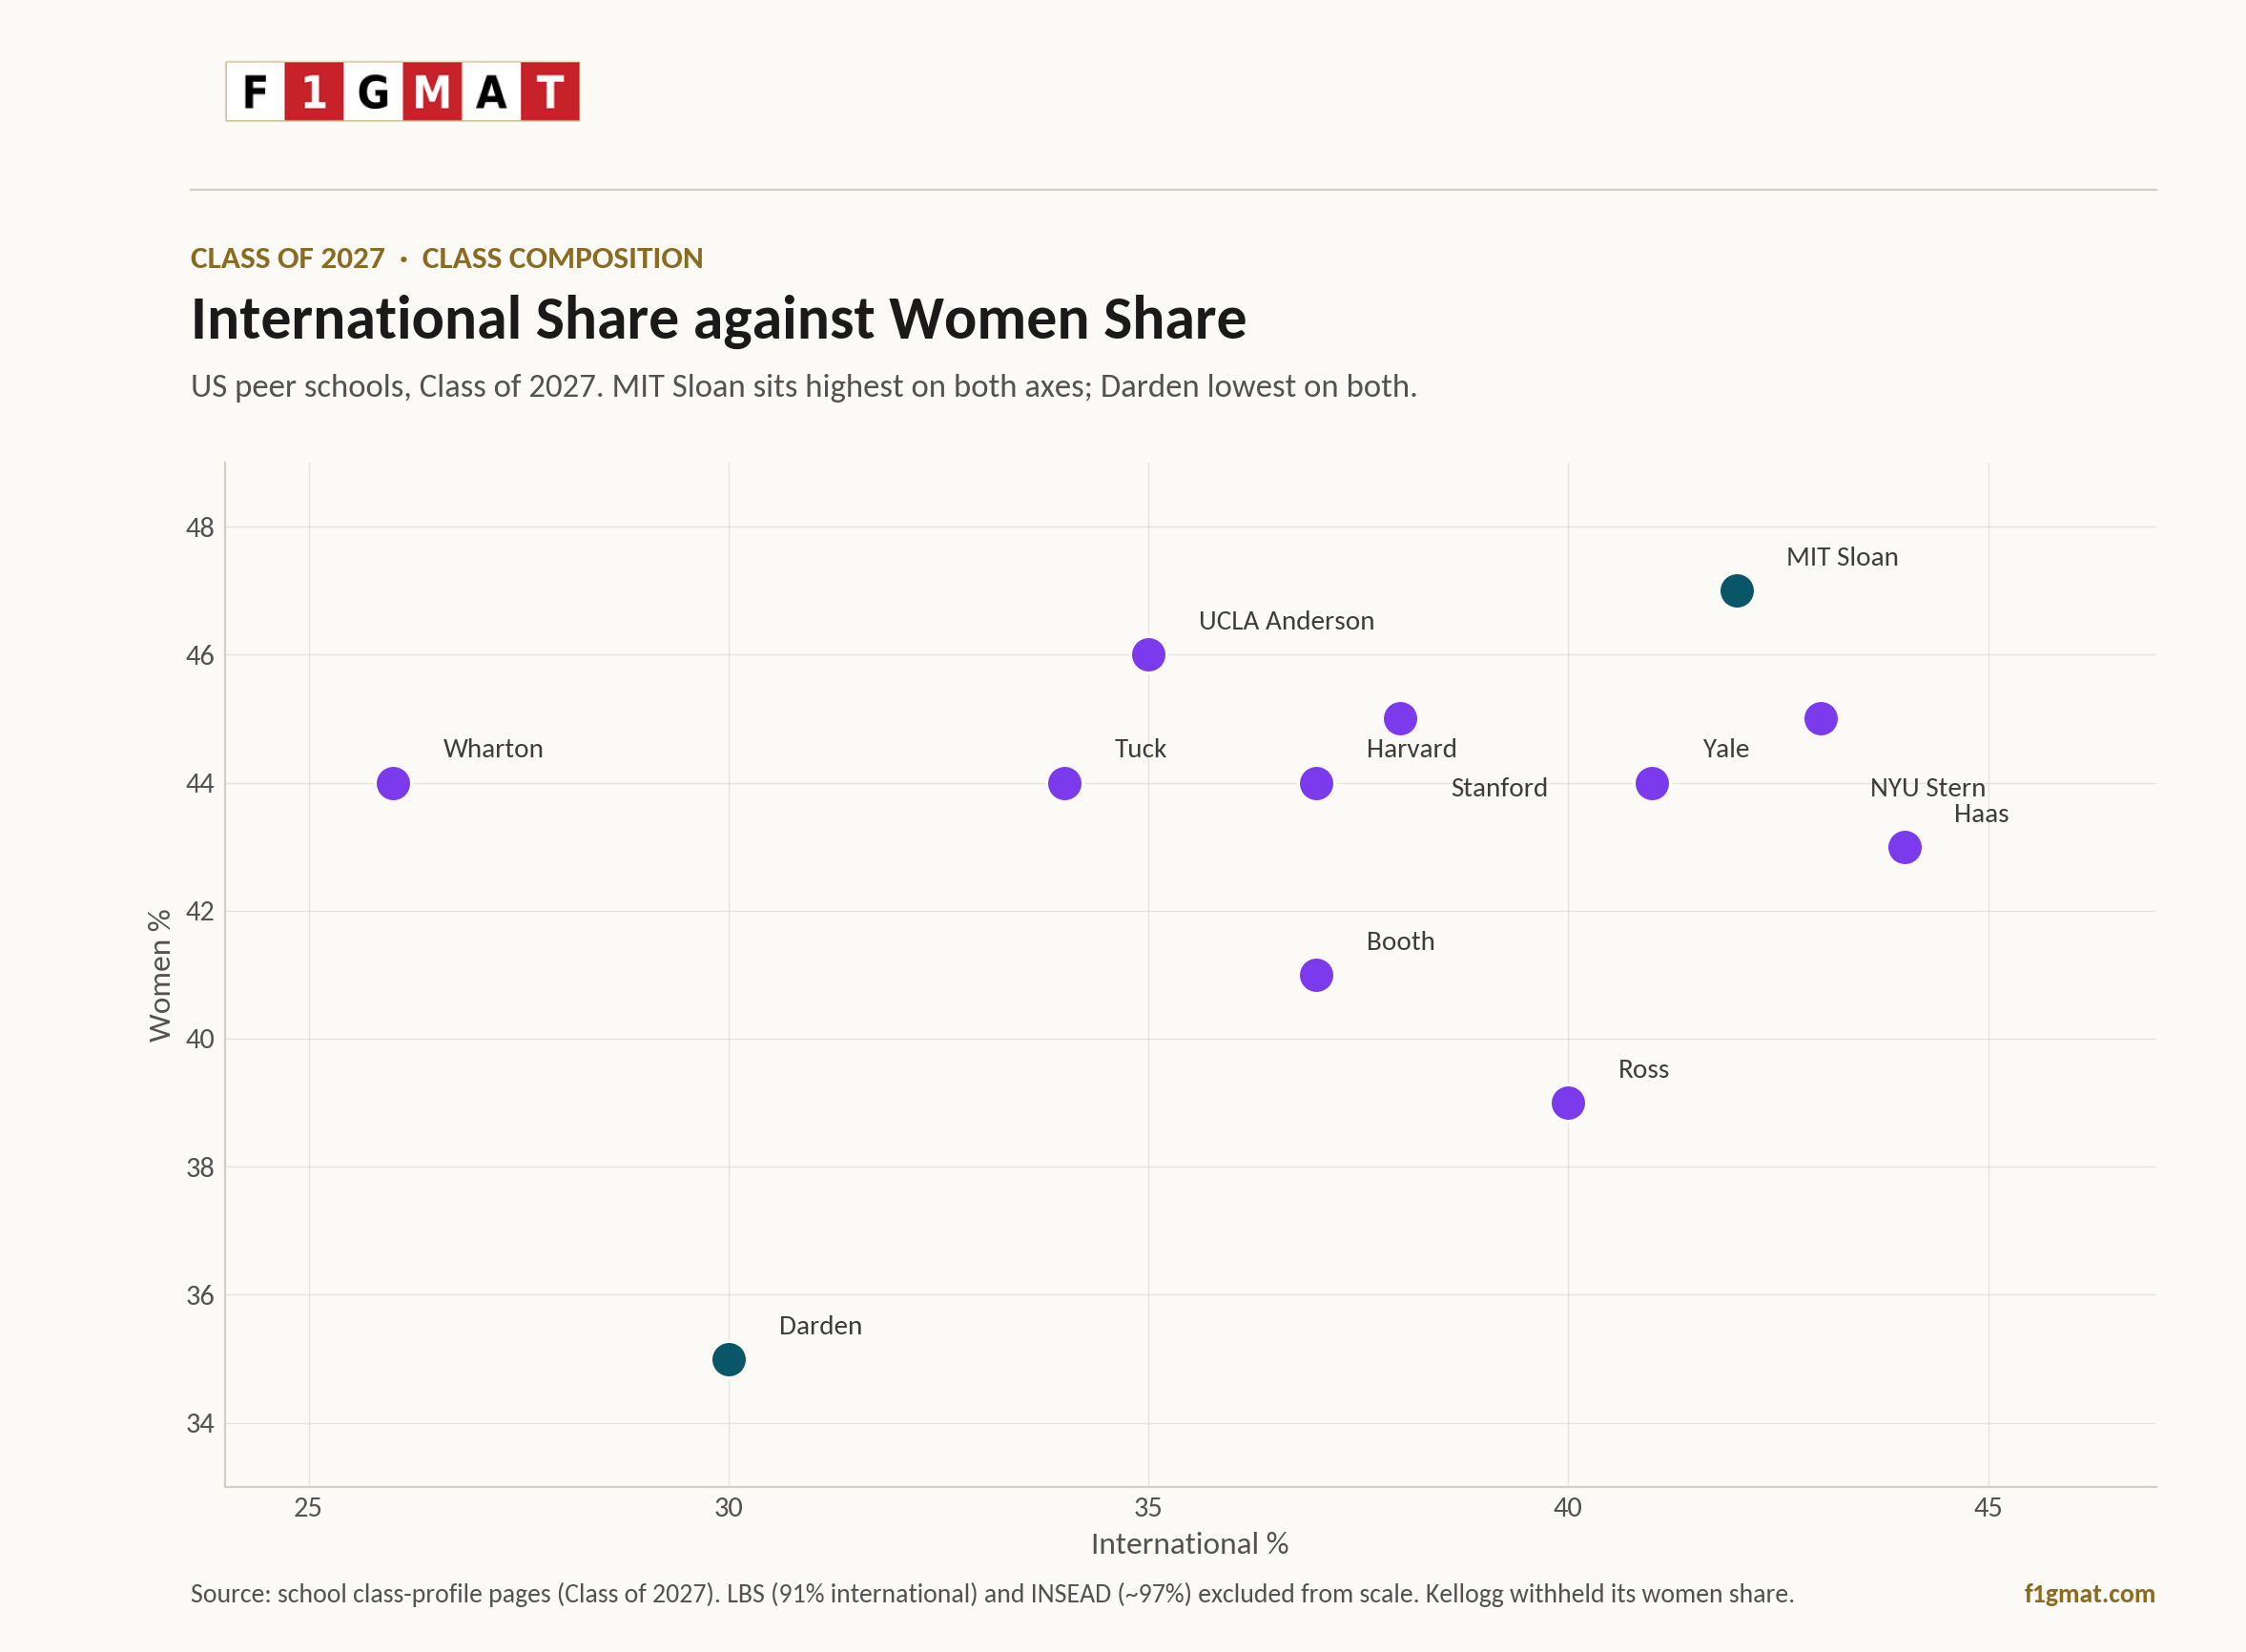
International Diversity
The international MBA class representation ranged widely across these 15 programs for the Class of 2027, from 44% at Haas, which ranked at the top to 30% at Darden, which ranked at the bottom.
Haas added six points over the Class of 2026, from 38% to 44%, and Wharton lost five, from 31% to 26%, the steepest fall for an M7 MBA.
Programs whose graduates moved into STEM-coded technology roles held or gained international share in the class, while programs whose international students targeted finance or consulting found it harder to secure a work-authorization extension. They all lost ground.
MIT Sloan was steady at 42%, and Stanford lost a point to 38% is within the yearly variations outside any single factor for two schools known for placing technology candidates.
Ironically, schools with strong technology DNA gained international share in a market where AI was disrupting the technology industry. The demand had shifted towards the top of the hierarchy - candidates with strong skills intersection in marketing, business development, and product proficiency, a rare mix that MIT, Stanford, and Haas attracted.
Another factor that affected the international percentage at Wharton is the STEM-designated path.
Wharton has 10 STEM-certified majors, but it still suffered in attracting talented international candidates.
The post-MBA placement trends have some answers.
For instance, the Class of 2025 sent 38.2% of Wharton graduates into financial services and another 28.2% into consulting.
Two-thirds of the class went into the two functions where the STEM-OPT is the hardest to clear.
Investment banking took 14.2%, private equity 13.4%.
Again, for such roles, firms prioritize local talent over international talent.
Technology, the one large destination where the role itself is STEM-coded, and employers sponsor at scale, took 15.3%, not a small percentage when compared to IB and PE, but during the recruitment cycle, employers were infrastructure-heavy and labor-light, with hyperscalers hiring AI engineers ahead of MBA product roles or even Sales & Marketing talent from Wharton(less than 5%).
This shift from engineering-heavy product roles to Sales and Marketing roles is the most visible when you look at UCLA Anderson, a historically known school for placing technology talents. The school's international student percentage dropped from 41% to 35%.
Stanford and Haas attracted the career pivoters from technology, who had the holistic career experience to transition into general management, operational, and sales & marketing roles.
Gender Diversity
MIT Sloan posted the highest share of women in the Top 15 at 47%, down two points from 49%.
Sloan has managed to find the intersection of strong women and international percentages.
UCLA Anderson rose three points to 46% while Stanford and NYU Stern both reported 45%.
Yale – Comeback Year for Women Candidates
Harvard, Wharton, and Tuck each report 44%, and Yale reached a school record of 44%, up five points from 39%, the largest single-year gain in the group.
London Business School slipped one point to 44%, from 45% the year before, the same single-point variation that Sloan reported – well within the normal variation.
The more telling variation was with Darden, which reported 35% women in the class, from 38% - the steepest drop among these five and consistent with a school that suspended both its Forté and Consortium partnerships in the summer after being named in the Justice Department complaint.
Ross eased one point to 39%, from 40%, and Booth, which has never leaned on the women 's-recruiting partnerships, attracted 41% women candidates.
Haas moved the other way, up one point to 43% from 42%, the only school with higher women representation in the 7 to 15 ranked MBA program. The Bay Area talent pool helped Haas maintain diversity. A different political orientation helped the school build a cushion against the same forces that pulled Darden down.
INSEAD held flat at 42% across the two intakes.
The most revealing development was that of Kellogg, which had reached gender parity for the Class of 2026, but withheld its women percentage for the Class of 2027 after ending its partnership with the Forté Foundation, the nonprofit that runs the fellowships and conferences feeding women applicants into the MBA program.
| Top 15 MBA | International % | Women % |
|---|---|---|
| Stanford | 38% | 45% |
| MIT Sloan | 42% | 47% |
| Harvard | 37% | 44% |
| Wharton | 26% | 44% |
| Booth | 37% | 41% |
| Kellogg | 37% | Not reported |
| Tuck | 34% | 44% |
| Yale | 41% | 44% |
| Darden | 30% | 35% |
| NYU Stern | 43% | 45% |
| Ross | 40% | 39% |
| Haas | 44% | 43% |
| LBS | 91% | 44% |
| INSEAD | ~97% (73 nationalities) | 42% |
| UCLA Anderson | 35% | 46% |
Top 15 MBA Class Profile - Undergraduate Degree
STEM Trends
MIT Sloan keeps its lead in STEM representation at 47%, up one point from 46%, the highest in the Top 15 by a wide margin.
Harvard climbed to 43% from 40% to accommodate international students' demand to pivot into the AI boom they are targeting.
Kellogg also held at 41%, tied with Stanford, which also reported 41%.
MIT, Harvard, Kellogg, and Stanford's STEM representation had a high correlation with international student representation, where most candidates target Technology or Consulting roles.
Below that top tier 40-47% STEM representation, the representation fell dramatically with Haas at 31%, Booth at 30% across engineering and physical sciences, UCLA Anderson at 28%, Ross at 27%, and NYU Stern at 25%.
Haas' 31% from STEM is the contrarian data that should surprise applicants until you look into the post-MBA function Haas graduates enter.
Marketing/sales at 9.2% and general management at 15.7%, while also placing 38.6% into technology, is the data that should confirm the low STEM representation at Berkeley.
Business/Economics
Business and economics undergraduates show the inverse logic.
Booth leads the representation at 50% of the Class of 2027, with NYU Stern and Kellogg close behind at 49% each, and Yale reaching 47% once its separately counted business (29%) and economics (18%) majors are combined.
The reason for Booth, NYU Stern, and Kellogg's high Business and Economics representation is that Booth sent 37.7% of the Class of 2025 into consulting and another 30.3% into finance. Over two-thirds of the class entered the two destinations where a business or economics foundation has direct application to the post-MBA work, with investment banking alone taking 11.9%.
A class composition that is heavily built on quantitative-business undergraduates feeds a placement profile dominated by consulting and finance.
But at the same time, if you look at Kellogg's 49%, the same business-and-economics foundation places students in a broader post-MBA industries and functions.
Consulting took the largest share of the Class of 2025 at 38%, up from 35% the prior year, with financial services a further 21%, up from 19%.
Around 60% of the class entered the two industries where a business or economics background is valued.
The difference from Booth is in technology, where Kellogg placed 19%, and consumer packaged goods, where it placed 9% - a legacy of Kellogg's marketing tradition.
The middle of that representation in Business and Economics is where the major-to-role correlation stops.
For instance, Stanford's placement data shows 42% business and economics intake, but the placements are not into a finance-and-consulting mono-culture the way Booth's 50% does.
Finance still placed 31% of Stanford's Class of 2025, but general management also took the single-largest share at 32%, with another 18% in business operations and strategy and 20% in marketing and sales, much of it tied to AI commercialization roles, while consulting fell to 12%.
The same business and economics foundation that maps onto banking at Booth maps onto operator and go-to-market roles at Stanford, while at Kellogg, the diversity is much broader across industries and functions - a factor that attracts a large percentage of international and local talent to Kellogg.
Yale reached 47% once its separately reported business (29%) and economics (18%) majors are combined, and its placement data shows that intake converts into one of the most concentrated consulting-and-finance profiles in the group.
Consulting took 48.4% of the Class of 2025, up from 45.4% the prior year, with finance and accounting a further 29.3%.
Nearly four-fifths of the class entered the two destinations where a business or economics foundation applies directly.
The internal split is where Yale Business and Economics majors' placement becomes interesting.
External consulting alone accounted for 36.7%, with another 11.6% in internal consulting and corporate strategy.
The in-house roles absorbed Yale MBAs as firms built their own transformation teams.
A 47% business-and-economics intake at Yale feeds an even heavier consulting-and-finance placement than Booth's 50% intake.
UCLA Anderson reports 43%, Harvard 41%, MIT Sloan 40%, Haas 38%, Ross 37%, Wharton 32%, and Tuck the lowest of the disclosing schools at 25%.
Humanities/Social Sciences
While Tuck is the lowest in Business/Economics representation, the program stands out in Humanities and Social Sciences, with 48% of the Class of 2027 coming from arts, humanities, or social-science backgrounds, the highest in the Top 15 and twelve points ahead of Wharton's 36%.
While we can assume the Business/Economics minority and STEM middle at Tuck pivoted to Investment banking, the class has an impressive record through its curriculum to place a largely non-business undergraduates to consulting.
The case method and the First-year project at Tuck place students in scoped, ambiguous client problems that mirror a consulting engagement.
A program curriculum structured with an ambiguous problem could be dissected by philosophy majors, who are used to quoting counterexamples to void a confident generalization, the way one overlooked customer segment sinks a market-entry thesis.
NYU Stern is way behind at 26%, Ross at 22%, Kellogg and UCLA Anderson at 21% each, and Yale at 20% - each acting as the feeder for the business development, marketing, and general management roles.
What is surprising is the low Humanities and Social Sciences background at Harvard (16%), Stanford (17%), and Haas (17%), despite high Business development, Marketing, and General Management post-MBA roles.
When you look closely, none of these roles need a humanities degree.
The operator and business development roles in AI post-Stanford or Haas, or the PE roles at Harvard, or Technology marketing roles are all in markets where a strong foundation in technology is important, even for sales, marketing, general management, or any operator role.
MIT Sloan, which favors quantitative undergraduate backgrounds, not surprisingly had the lowest Humanities/Arts representation at 7%.
| Top 15 MBA | STEM | Business/Economics | Humanities/Social Sciences |
|---|---|---|---|
| Stanford | 41% | 42% | 17% |
| MIT Sloan | 47% | 40% | 7% |
| Harvard | 43% | 41% | 16% |
| Wharton | 32% | 32% | 36% |
| Booth | 30% | 50% | 13% |
| Kellogg | 41% | 49% | 21% |
| Tuck | 22% | 25% | 48% |
| Yale | 32% | 47% | 20% |
| Darden | NA | NA | NA |
| NYU Stern | 25% | 49% | 26% |
| Ross | 27% | 37% | 22% |
| Haas | 31% | 38% | 17% |
| LBS | NA | NA | NA |
| INSEAD | 24% | 46% | 15% |
| UCLA Anderson | 28% | 43% | 21% |
Top 15 MBA Class Profile - Pre-MBA Industry
Consulting is the largest pre-MBA industry across most M7 and Top 15 programs for the Class of 2027.
MIT Sloan posts the highest share at 35%, just ahead of INSEAD at 34% and Yale at 33%, with Kellogg at 32% and Wharton at 31% close behind.
Although INSEAD's consulting placement is not surprising, given the large percentage of consultants who join, Yale, with its unique raw case legacy, and Kellogg's pivot over the last decade from marketing to a consulting school, MIT's class, mostly represented by consultants, is not a unique trend if you look at the past three years.
While schools pivoted aggressively towards consulting during the boom cycle 21-22 before AI, MIT has been steady with the 30-33% Consulting intake.
MIT positioned itself in a perfect post-MBA AI job market.
Sloan sends a higher proportion of graduates into implementation-heavy, analytics-driven engagements, AI deployment, advanced analytics rollout, supply-chain optimization, cost restructuring, and post-merger integration, and a smaller proportion into the pure strategy tracks built on regular CXO interaction that define consulting at Harvard and Stanford.
The MIT graduate works with middle management and technology teams on bottom-up delivery of transformation projects.
The alignment helped MIT Sloan keep the consulting hiring percentage stable while peers saw sharper declines.
The school is positioning the analytics-led specialists from consulting toward AI-integration and product-strategy consulting roles.
LBS draws 29%, Haas 24%, and Booth 23%, while Stanford (20%), Harvard (19%), and Tuck (19%) are at the low end for the elite schools.
The smallest consulting intakes are at Ross (16%), NYU Stern (15%), Darden (13%), and UCLA Anderson (9%), where industry-specific feeders take a larger share.

The small pre-MBA consulting intake at these three schools is not a sign of weak consulting outcomes.
Look at this way - Ross places 33.5% of its Class of 2025 into consulting, the single largest industry destination, down from 36% in 2024 and 44.9% in 2023, even though only about 16% of the incoming class arrived from consulting, a switch-in gap of roughly 17 points that the program itself produces.
NYU Stern admits roughly 15% of its class from consulting backgrounds yet places 32.8% into consulting, a net swing of about 18 points that the program itself produces.
Darden admits near 13% from consulting and places 37.3%, a net addition of about 24 points, meaning close to a quarter of the entire class enters consulting from a different field.
UCLA Anderson admits about 9% and places 25.6%, a swing of roughly 17 points.
Because each gap is a net figure, it already subtracts any pre-MBA consultants who left the field.
The true career switchers into consulting are at least this large.
The only disadvantage when an MBA class has few consulting peers is the networking that is often required to get your foot in the door of an internship.
When you are a career switcher, choose the MBA with a healthy mix of pre-MBA industry representation.
Private Equity and Venture Capital
The representation in PE/VC for the 2027 class belongs to the buy-side schools, with Stanford placing 16% into private equity plus 6% into venture capital, Wharton placing 13.4% into PE plus 2.8% into VC, and Harvard near 16% combined on a function basis. The share collapses at the banking-oriented schools, MIT at 3.1% PE and 2.2% VC, and Stern at 1.3% PE and 1.7% VC.
A school's PE placement rises with how ownership-oriented its finance culture is, rather than with its overall finance size. Stanford's finance ecosystem is ownership-oriented, its investment banking down to 3% while private equity and hedge funds continued deploying, and its curriculum and West Coast location prepare graduates for the buy-side roles. At the low end, Stern's own page gives the mechanism, that PE hires through pre-MBA analyst pipelines and recruits the graduating class only rarely.
A high PE intake at Stanford or Wharton is partly former investors returning, and the placement share at those two schools is substantial.
The correlation is evident when you see that for Stanford, the PE/VC share was 17% of the incoming class, for Harvard, it was 16%, and for Wharton, the numbers were between Stanford and Harvard at 15%.
Technology
The pre-MBA industry draws a large share of the Class of 2027, led by Haas at 21% in high tech and electronics and UCLA Anderson at 20%, the two California programs closest to the Bay Area, along with Stanford, which has kept the technology intake at 15%.
The pre-MBA industry to post-MBA placement aligns consistently for the three programs when the latest employment reports in these schools show Haas at 38.6% on its wider technology-and-electronics definition, Stanford at 35%, and UCLA Anderson at 28.3%.
More than half of Stanford's class is placed in the West, near the foundation-model companies and cloud platforms, and Haas draws on the same Bay Area concentration of employers.
Financial Services
The industry representation in Finance is led by the two schools embedded in the Northeast finance corridor.
Wharton at 38.2% and NYU Stern at 36.6% lead with Stanford and Harvard tied at 33%.
Finance intake and finance placement stay close at most of these schools.
The industry largely replaces its own people rather than absorbing career switchers.
Wharton's investment banking alone took 14.2% of its class as a deal-value recovery favored execution-heavy teams in the U.S. Northeast, where the school has long placed its finance-bound graduates.
The recruiting prioritizes asset management, and corporate finance roles that reward analytical depth, which keeps the entry limited for candidates without a finance background.
Government / Non-Profit / Education
The public sector representation is strongest at Tuck at 14%, followed by Booth at 12% and Wharton at 10%.
Stanford, Ross, and UCLA Anderson each report 9%, with MIT Sloan at 7% and LBS at 6%.
Kellogg reports a combined education and impact-sector share without a separate percentage for each.
The interesting pre-MBA to post-MBA pivot trend is that Government, non-profit, and education have almost no placement side to rank, and the one school that reports it is Stanford, which placed 1% of its class into nonprofit and government against a 9% pre-MBA intake.
With USAID ceasing operations on July 1, 2025, 83% of its programs were canceled, and 94% of staff were laid off where more than 300,000 federal workers and contractors were let go (and roughly $9 billion in foreign aid rescinded). The transition was not easy for most.
A oneAID report[16] shows that around half of former USAID staff are still unemployed a year later. These public-sector skills are different from the consulting skills, where most non-profit, government, and education candidates pivot.
From a pure ROI perspective, these candidates have the highest return on investment regardless of whether they enter consulting, finance, or the technology industry, as they tend to earn the lowest pre-MBA salary compared to their peers.
Healthcare / Biotech / Pharma
The healthcare niche is a larger feeder group at Tuck and Darden, each at 9%, and at Harvard at 8%. Stanford and Ross report 7%, Kellogg 6%, and Haas and Booth 5% each.
Placements to Healthcare, biotech, and pharma rank highest at the operations-weighted schools - Ross at 10.2%, MIT Sloan at 8.1%, and Kellogg at 6%, UCLA at 5.6%, Stanford at 5%.
Healthcare placement holds at the schools built around operations and those where the class skews toward early-stage roles.
This trend is explained through Private capital, which continued to flow into healthcare services and biopharma, one of the largest PE deployment categories, while integration complexity and regulatory scrutiny held hiring volumes down and kept the surviving roles in strategy, finance, and operations.
CPG / Consumer Products / Retail
The representation in CPG/Consumer Products/Retail is most visible at Harvard at 9% and LBS at 7% (FMCG, retail, luxury, and e-commerce).
Tuck reports 6%.
Interestingly, none of the schools lead in retail placements, with Kellogg true to its legacy placed 9% and Ross at 8.9%, with UCLA at 5.6% to these industries.
The margin pressure has mounted with a weak job market, and tariff uncertainty that has added to the input costs, private-label competition, and weak brand loyalty, moving hiring out of brand management and into pricing, revenue management, and supply-chain analytics.
The pre-MBA CPG to post-MBA CPG is a weak career path for career switchers.
Engineering / Manufacturing / Energy
The pre-MBA representation in Engineering, Manufacturing & Energy is the largest at Harvard, where manufacturing, industrial, and energy roles pre-MBA together account for 8%.
Ross reported 6% in engineering and manufacturing, LBS 6% in manufacturing, industrials, and transport, and Booth 3% in energy.
Manufacturing placement concentrates at the operator schools, and the degree opens the field to newcomers only in small numbers for career switchers.
The energy placements are in small numbers for high-paying specialist roles, with Stanford placing 4%, MIT at 3.1%, Ross at 2.6% in the lead, and Darden at 2.4%.
MIT places the fewest of the three, but is at the top median base salary.
Energy hiring depends on data-center power demand and project finance roles, which pre-select candidates with operating or engineering experience.
It is a premium niche among the top 15 MBA programs.
Media / Entertainment
The class representation in Media and Entertainment is highest at NYU Stern at 6% in entertainment and media, and LBS at 6% in leisure, sports, entertainment, and media.
Harvard reports 5% in media, entertainment, and travel, and UCLA Anderson folds the sector into its broader media and entertainment mix.
The placement tells a different story.
The industry survives mainly where the employers are located, UCLA at 7.2%, NYU Stern at 2.2%, and Kellogg and Stanford near 2%.
Streaming consolidation and an advertising reset moved the remaining roles toward finance, portfolio strategy, and ad monetization, and those jobs are concentrated in Los Angeles, which is why UCLA is at the top of the leader board while the rest place in low single digits.
Military / Veterans
Veterans measured as the share of the class identifying as veterans in their latest role, is highest at Ross at 15% and Darden at 12%.
Booth reports 11%, NYU Stern and Kellogg 9% each, Haas 6%, UCLA Anderson 4%, and Harvard 3% under its military as the last-employer category.
Kellogg attributes its record share directly to the new Matt Caldwell Veterans Program[17], which funds and supports the military-to-MBA transition.
Ross has a different advantage.
As a public university, Ross grants veterans in-state tuition plus full Post-9/11 GI Bill and Yellow Ribbon coverage. So when applicants weigh cost more heavily, Ross becomes the lowest-cost elite option for a veteran.
| Top 15 MBA | Pre-MBA Industry | % (Class of 2027) | Top 15 MBA | Pre-MBA Industry | % (Class of 2027) |
|---|---|---|---|---|---|
| Stanford | Consulting | 20% | Booth | Consulting | 23% |
| Investment Mgmt/PE/VC | 17% | Financial Services | 22% | ||
| Technology | 15% | Non-Profit/Government | 12% | ||
| Government/Education/Non-Profit | 9% | Technology | 10% | ||
| Consumer Products & Services | 7% | Private Equity/Venture Capital | 8% | ||
| Healthcare | 7% | Healthcare | 5% | ||
| Consumer Products | 3% | ||||
| Energy | 3% | ||||
| Harvard | Consulting | 19% | Wharton | Consulting | 31% |
| Venture Capital/Private Equity | 16% | Private Equity/Venture Capital | 15% | ||
| Technology | 13% | Nonprofit/Government | 10% | ||
| Financial Services | 10% | Investment Banking | 8% | ||
| CPG/Retail/E-Commerce | 9% | Technology | 8% | ||
| Manufacturing/Industrial/Energy | 8% | ||||
| Healthcare/Biotech | 8% | ||||
| Nonprofit/Government/Education | 6% | ||||
| Media/Entertainment/Travel | 5% | ||||
| Military | 3% | ||||
| Kellogg | Consulting | 32% | Yale | Consulting | 33% |
| Financial Services | 24% | Finance/Accounting | 25% | ||
| Technology/Communications | 15% | Other | 16% | ||
| Healthcare/Biotech | 6% | ||||
| MIT Sloan | Consulting | 35% | Tuck | Financial Services | 19% |
| Financial Services | 18% | Consulting | 19% | ||
| Technology | 17% | Nonprofit/Government | 14% | ||
| Government/Non-Profit/Education | 7% | Technology | 11% | ||
| Healthcare/Pharma/Biotech | 9% | ||||
| Consumer Goods/Retail | 6% | ||||
| Other | 12% | ||||
| LBS | Consulting | 29% | Haas | Consulting | 24% |
| Finance | 25% | High Technology/Electronics | 21% | ||
| Technology/FinTech/Telecom | 9% | Financial Services | 20% | ||
| FMCG/Retail/Luxury/E-commerce | 7% | Other | 10% | ||
| Public Sector/Gov/NGO/Nonprofit | 6% | Health/Pharma/Biotech | 5% | ||
| Manufacturing/Industrials/Transport | 6% | Not-for-Profit | 5% | ||
| Leisure/Sports/Entertainment/Media | 6% | Consumer Products/Retail | 4% | ||
| Healthcare | 5% | Military | 4% | ||
| Energy/Utilities | 4% | ||||
| NYU Stern | Financial Services | 31% | UCLA Anderson | Technology | 20% |
| Consulting | 15% | Finance | 19% | ||
| Technology | 8% | Consulting | 9% | ||
| Entertainment/Media | 6% | Government/Education/Impact | 9% | ||
| Military/Government | 5% | ||||
| Law | 4% | ||||
| Nonprofit/Arts/Education | 4% | ||||
| Healthcare/Pharma | 4% | ||||
| Real Estate | 3% | ||||
| Advertising/PR | 3% | ||||
| Manufacturing/Trade | 3% | ||||
| Ross | Financial Services | 17% | Darden | Financial Services | 22% |
| Consulting | 16% | Technology | 14% | ||
| Education/Nonprofit/Government | 9% | Consulting | 13% | ||
| Technology | 8% | Other | 11% | ||
| Healthcare | 7% | Government | 11% | ||
| Military | 7% | Biotech/Healthcare/Pharma | 9% | ||
| Engineering/Manufacturing | 6% | ||||
| INSEAD | Consulting | 34% | |||
| Corporate | 27% | ||||
| Financial Services | 19% | ||||
| Technology/Media/Telecom | 19% |
Related Essay Guides
Each guide includes school-specific essay analysis, narrative strategies, sample essays, and review tips. These are F1GMAT internal resources.
Related F1GMAT Reads
• Top 15 MBA Class Profile - Class of 2026
• Top 15 MBA Class Profile - Class of 2025
• Top 20 MBA Programs - Total Cost and Total Salary (2026)
• Top 70 MBA Programs - GMAT and GPA Scores (2026)
• M7 MBA - Complete Guide (2026)
• Top 50 MBA Programs - International Percentage (2026)
• Top 50 MBA - Average Age and Work Experience (2026)
