A Harvard MBA is an investment of roughly $433,000 to $663,000 once you count tuition and the two years of salary you give up to enroll, with the exact figure depending on what you earned before and how that salary is measured.
Whether it pays off depends almost entirely on the industry you come from.
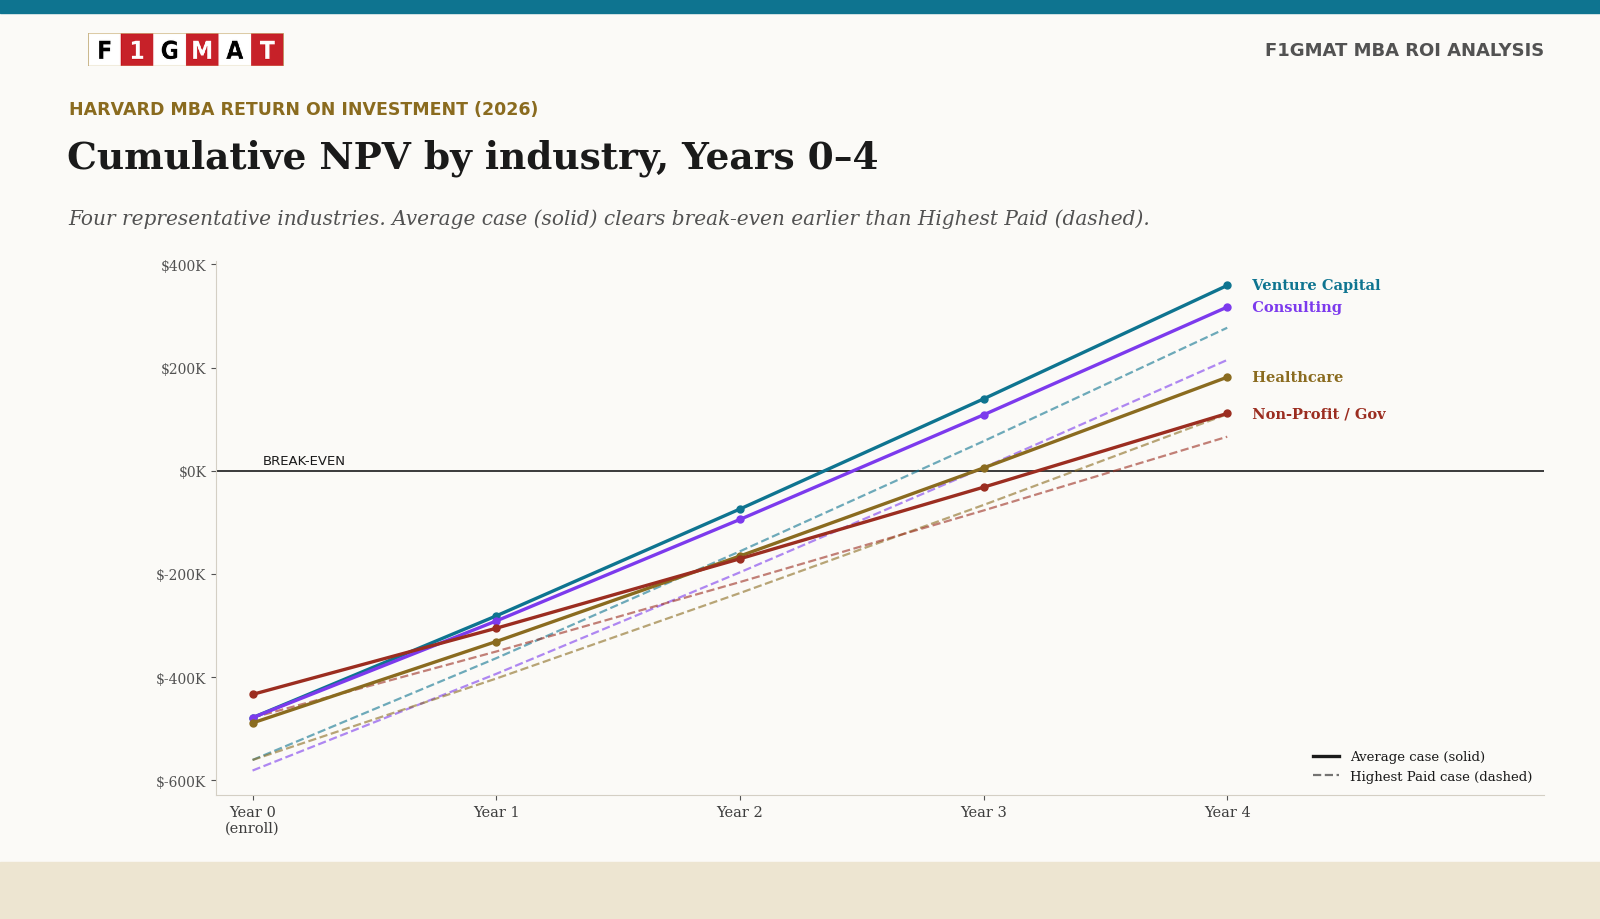
We ran a net present value (NPV) model on the Class of 2025 under two pre-MBA salary cases: a Highest Paid case using top-of-market figures, and an Average case using base salaries triangulated from compensation surveys, U.S. Bureau of Labor Statistics data, H-1B disclosures, and self-reported pay. Under the Average case, ten of eleven pre-MBA industries earn the investment back by the end of Year 3; under the Highest Paid case, four do, with the rest reaching break-even in Year 4. This analysis walks through the cost build-up, both break-even timelines for each industry, and the salary math that drives the difference.
TL;DR (At a Glance)
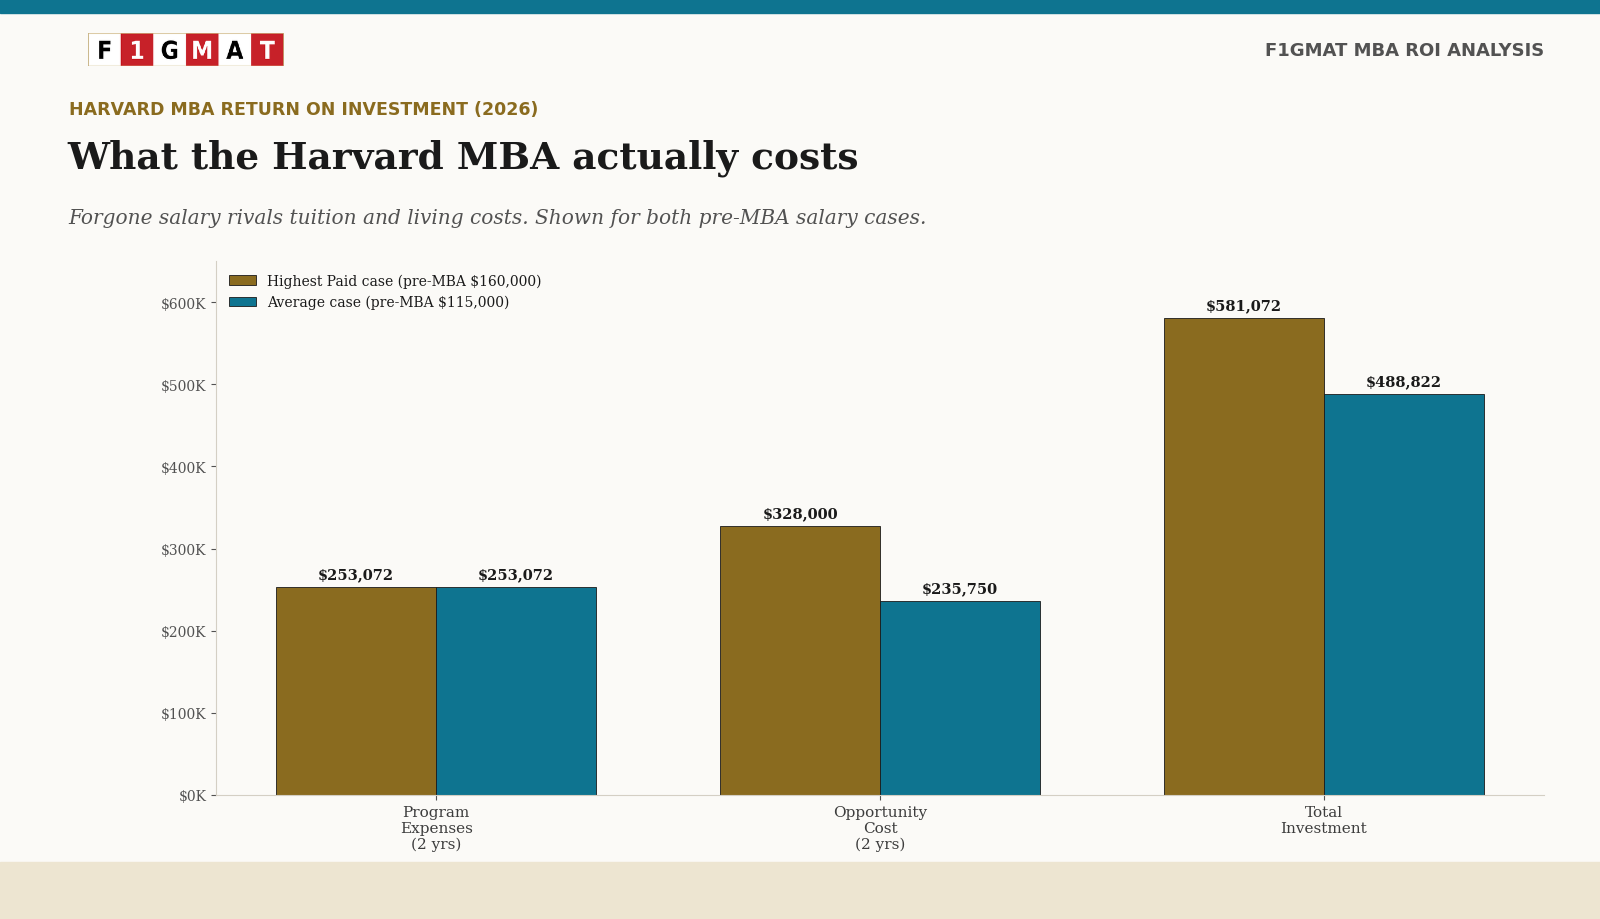
- A Harvard MBA costs roughly $433,000 to $663,000 all-in (two years of tuition and living costs of $253,072, plus two years of forgone salary), depending on your pre-MBA industry and how pre-MBA pay is measured.
- We model two pre-MBA salary cases: a Highest Paid case (top-of-market figures, $110K–$200K) and an Average case (triangulated base salaries, $88K–$150K). Both appear in every table.
- Under the Average case, ten of eleven pre-MBA industries break even by Year 3.
- Under the Highest Paid case, four do, and the rest reach break-even in Year 4.
- The fastest payback comes from Venture Capital, Entertainment/Media, and Consulting.
- The slowest is Non-Profit/Government, the only industry still negative at Year 3 under both cases.
- Lower pre-MBA salary means lower opportunity cost, so a realistic Average-case candidate recovers the investment faster
Harvard MBA Return on Investment
In this detailed Harvard MBA ROI analysis using Net Present Value (NPV) methodology, incorporating the latest employment data, tuition costs, and opportunity costs, we explore break-even timelines, and examine variations by key industries to help you decide if a Harvard MBA is the right financial move for 2026 and beyond.
Contents
- Key Data for Harvard Business School MBA ROI
- HBS MBA NPV Calculation for ROI - Is Harvard MBA Worth It?
- Harvard MBA - Aggregate Industry (Median Base Salary) (ROI Calculation)
- Harvard MBA ROI by Industry 2025
- Harvard MBA - Consulting Industry (Median Base Salary) (Harvard MBA Cost vs. Salary)
- Harvard MBA - Technology Industry (Median Base Salary) (ROI Calculation)(Harvard MBA Cost vs. Salary)
- Harvard MBA - Private Equity Industry (Median Base Salary) (ROI Calculation)(Harvard MBA Cost vs. Salary)
- Harvard MBA - Investment Management/Hedge Fund (Median Base Salary) (ROI Calculation)(Harvard MBA Cost vs. Salary)
- Harvard MBA - Healthcare Industry (Median Base Salary) (ROI Calculation)(Harvard MBA Cost vs. Salary)
- Harvard MBA - Investment Banking Industry (Median Base Salary) (ROI Calculation)(Harvard MBA Cost vs. Salary)
- Harvard MBA - Manufacturing Industry (Median Base Salary) (ROI Calculation)(Harvard MBA Cost vs. Salary)
- Harvard MBA - Non-Profit/Government Industry (Median Base Salary) (ROI Calculation)(Harvard MBA Cost vs. Salary)
- Harvard MBA - Venture Capital Industry (Median Base Salary) (ROI Calculation)(Harvard MBA Cost vs. Salary)
- Harvard MBA - Consumer Products Industry (Median Base Salary) (ROI Calculation)(Harvard MBA Cost vs. Salary)
- Harvard MBA - Entertainment/Media Industry (Median Base Salary) (ROI Calculation)(Harvard MBA Cost vs. Salary)
- Factors Affecting Harvard Business School ROI Analysis
- Methodology: How We Estimated Pre-MBA Salary
- Harvard MBA Investment Return (2026)
- Key Takeaways
- FAQ
Key Data for Harvard Business School MBA ROI
Total Program Cost (Expenses)
The cost of attendance for the 2025-2026 academic year is $126,536 per year for a single student, on Harvard's nine-month budget. It breaks down into tuition ($78,700), mandatory fees ($8,908: a $1,800 health fee, $4,308 health insurance, and $2,800 in course and program materials), and estimated living expenses ($38,928, with Cambridge/Boston housing the largest component at roughly $18,900)[1]
Across the two-year program this totals $253,072, the program-cost figure used in the ROI calculations below.
Pre-MBA Salary (Assumption)
We model two pre-MBA salary cases. The Highest Paid case uses the figures top-of-market candidates command before Harvard, ranging from $110,000 in non-profit-adjacent roles to $200,000 in investment management. The Average case uses base salaries triangulated from compensation surveys, U.S. Bureau of Labor Statistics data, H-1B disclosures, and self-reported pre-MBA pay, which run lower (a pre-MBA consultant earns about $110,000 base, not the $160,000 the headline assumption once used). Both cases appear side by side in every table below, and the Average derivation is detailed in the Methodology section. The aggregate calculation uses a $115,000 Average pre-MBA base.
Opportunity Cost
We used a 5% annual increase in opportunity cost.
Post-MBA Salary
Median base salary of $185,000 for the Class of 2025[2], with 5% annual growth is assumed.
Please note that the general median salary is used for easier calculation.
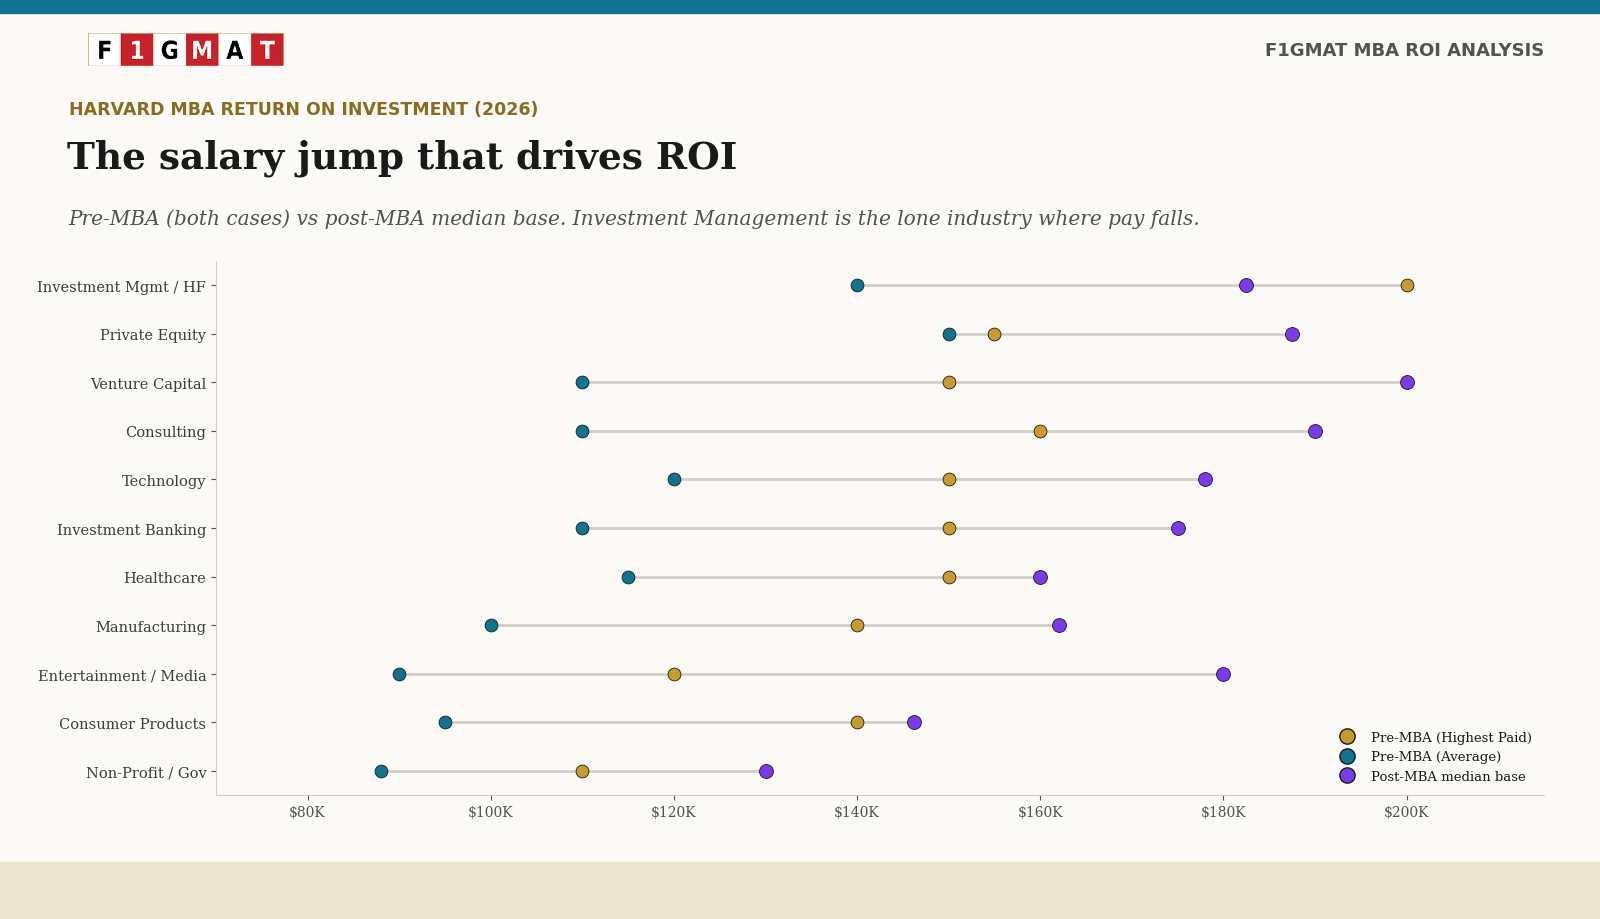
Highest Paying Industry and Function: Across industries, the highest-paying post-MBA placements (Consulting at about $190,000 and Private Equity at about $187,500) sit roughly $60,000 above the lowest (Non-Profit/Government at about $130,000). On the job-function axis, Finance functions cluster near $177,500. These are post-MBA figures, not pre-MBA, and the two should not be confused when reading the opportunity-cost columns below.
Bonuses (Not used for ROI Calculation)
The Median signing bonus was $30,000 (received by 58%) and the median performance bonus was $46,000 (received by 67%). However, our NPV focuses on base salary for conservative estimates, as in standard methodologies. This is because, if you consider taxation, these bonuses often get negated assuming the candidates are all operating as salaried professionals.
Several Finance roles have sophisticated tax-saving strategies.
Harvard MBA total compensation is much higher.
Growth Rate
We are using a 5% annual salary increase post-MBA.
Real Interest Rates
Based on forecasts, we use interest rates of 4.2%, 3.4%, 3.4%, 3.4%, 3.4%, 3.4% for 2025 to 2030.
Based on forecasts and changes in Tariff policies, we use inflation rates 2.8%, 2.7%, 2.3%, 2.1%, 2.0%, 2.0% for 2025 to 2030.
For Real Rate of Interest, we subtract Interest Rates from the Inflation rates as illustrated in the table below.
| Interest Rates | Inflation Rates | Real Rate of Interest (Interest Rate - Inflation Rate) | Year |
| 4.20% | 2.8% | 1.4% | 2025 |
| 3.40% | 2.7% | 0.7% | 2026 |
| 3.40% | 2.3% | 1.1% | 2027 |
| 3.40% | 2.1% | 1.3% | 2028 |
| 3.40% | 2.0% | 1.4% | 2029 |
| 3.40% | 2.0% | 1.4% | 2030 |
Discount Factor
Year | Discount Factor |
| Year One | 1.014 |
| Year Two | 1.014 |
| Year Three | 1.033 |
| Year Four | 1.053 |
| Year Five | 1.071 |
Employment Statistics at Harvard MBA – Salaried vs. Entrepreneurship
65% sought jobs, 90% received offers within 3 months, 35% pursued entrepreneurship or other paths. These figures show how structurally the HBS Class of 2025 are oriented and the data you should closely evaluate for a realistic ROI calculation.
Methodology for Calculating Harvard MBA Salary and ROI
We follow a Net Present Value (NPV) approach to evaluate ROI, as explained in our HBS vs. Stanford MBA ROI Calculation with NPV. The pre-MBA Average-case derivation is detailed in the Methodology section.
HBS MBA NPV Calculation for ROI - Is Harvard MBA Worth It?
Net Present Value or NPV calculates the future cash flow from the MBA in current value while discounting tuition fees and opportunity costs.
NPV is an accurate way to a simple salary - cost calculation seen in other payback calculations.
Key Formulas
Total Cost = Program Expenses (2 years) + Opportunity Cost (2 years of forgone pre-MBA salary)
Opportunity Cost = Pre-MBA Salary Year 1 + (Pre-MBA Salary Year 1 × 5%)
Post-MBA Salary (Year t) = Year 1 Salary × (1 + 5%)^(t-1)
Present Value (PV) of Year t Salary = Post-MBA Salary (Year t) / ∏(1 + Discount Rate)
NPV = -Total Cost + Σ PV of Post-MBA Salaries (Years 1-3)
Assumptions
We are applying a conservative estimate and ignoring bonuses, stock options, or faster promotions often seen in HBS post-MBA careers.
Total Cost (Harvard MBA)
Program Expenses: $126,536 × 2 = $253,072
Opportunity Cost: $160,000 (Year 1) + $168,000 (Year 2) = $328,000
Total Cost: $253,072 + $328,000 = $581,072
Average case: The worked example above uses the Highest Paid pre-MBA figure of $160,000. Using the Average aggregate pre-MBA base of $115,000, opportunity cost is $115,000 + $120,750 = $235,750, and total cost is $253,072 + $235,750 = $488,822.
The per-industry tables below report both cases.
Post-MBA Salaries with Growth
Year 1 (2025): $185,000
Year 2 (2026): $185,000 × 1.05 = $194,250
Year 3 (2027): $194,250 × 1.05 = $203,962
Year 4 (2028): $203,962 × 1.05 = $214,161
Harvard MBA - Aggregate Industry (Median Base Salary) (ROI Calculation)
Year | Post-MBA Salary | Discount Factor | Present Value | Cumulative NPV |
| Pre-MBA Salary (Year 0) | Total Cost (2 years) | Opportunity Cost (Year 0) | Sum (Year 0) | |
| Year 0 | $160,000 | $253,072 | $328,000 | -$581,072 |
| 1 | $185,000 | 1.014 | $182,445 | -$398,627 |
| 2 | $194,250 | 1.014 | $191,568 | -$207,059 |
| 3 | $203,962 | 1.033 | $197,446 | -$9,613 |
NPV After 3 Years (Highest Paid): -$9,613 (breaks even early Year 4)
Average case: With the $115,000 aggregate pre-MBA base, total cost is $488,822 and the same post-MBA salaries yield NPV after 3 years of +$82,638, a break-even inside Year 3.
Related: Harvard MBA vs Stanford MBA cost
Harvard MBA Payback Period
Under the Highest Paid case the investment is slightly negative at Year 3 and turns positive early in Year 4. Under the Average case it turns positive within Year 3. Either way, the payback lands in the Year 3 to early Year 4 window.
Risk of Recession
This calculation assumes steady 5% growth and no major economic downturns. During the 2008-09 financial crisis, even HSW and M7 MBA programs struggled to place MBA candidates to Finance. With credit market overheating and PE investments mostly in AI, the bubble could burst and affect PE/IB roles, the two high-paying roles during 2025.
Factoring in bonuses shortens payback further, adding the median signing bonus ($30,000) and performance bonus ($46,000) in Year 1 boosts inflows.
Long-Term HBS MBA Earning
Longer-term, HBS alumni often see lifetime earnings exceed $8.5 million, far surpassing non-MBA paths.
The IMPACT of Scholarships on Harvard MBA ROI Calculation
Scholarships (available to ~50% of students, averaging $50,000/year) can reduce costs by up to $100,000[3], improving ROI further.
Harvard MBA ROI by Industry 2025
ROI varies by post-MBA industry due to differing starting salaries, and by pre-MBA industry due to differing opportunity cost.
Using 2025 industry data from F1GMAT’s Harvard MBA Salary by Industry analysis for 2025, here is a comparison for top industries. Each industry table reports the Highest Paid case in the year-by-year breakdown, with the Average case summarised in the teal line beneath.
Harvard MBA - Consulting Industry (Median Base Salary) (Harvard MBA Cost vs. Salary)
Highest Paid Case (Original Pre-MBA Salary Assumption)
Year | Post-MBA Salary | Discount Factor | Present Value | Cumulative NPV |
| Pre-MBA Salary (Year 0) | Total Cost = Program Expenses (2 years) | Opportunity Cost (2 years forgone pre-MBA salary, 5% growth Yr2) | Sum(Total Cost, Opportunity Cost) (Year 0) | |
| Year 0 | $160,000 | $253,072 | $328,000 | -$581,072 |
| 1 | $190,000 | 1.014 | $187,377 | -$393,695 |
| 2 | $199,500 | 1.014 | $196,746 | -$196,949 |
| 3 | $209,475 | 1.033 | $202,783 | $5,834 |
NPV After 3 Years: -$581,072 + ($187,377 + $196,746 + $202,783) = $5,834
Break-Even: Year 3
Average Case – Consulting (Lower Pre-MBA Salary, Lower Opportunity Cost)
Year | Post-MBA Salary | Discount Factor | Present Value | Cumulative NPV |
| Pre-MBA Salary (Year 0) | Total Cost = Program Expenses (2 years) | Opportunity Cost (2 years forgone pre-MBA salary, 5% growth Yr2) | Sum(Total Cost, Opportunity Cost) (Year 0) | |
| Year 0 | $110,000 | $253,072 | $225,500 | -$478,572 |
| 1 | $190,000 | 1.014 | $187,377 | -$291,195 |
| 2 | $199,500 | 1.014 | $196,746 | -$94,449 |
| 3 | $209,475 | 1.033 | $202,783 | $108,334 |
Average Case – NPV After 3 Years: -$478,572 + ($187,377 + $196,746 + $202,783) = $108,334
Average Case – Break-Even: Year 3
Harvard MBA - Technology Industry (Median Base Salary) (ROI Calculation)(Harvard MBA Cost vs. Salary)
Highest Paid Case (Original Pre-MBA Salary Assumption)
Year | Post-MBA Salary | Discount Factor | Present Value | Cumulative NPV |
| Pre-MBA Salary (Year 0) | Total Cost = Program Expenses (2 years) | Opportunity Cost (2 years forgone pre-MBA salary, 5% growth Yr2) | Sum(Total Cost, Opportunity Cost) (Year 0) | |
| Year 0 | $150,000 | $253,072 | $307,500 | -$560,572 |
| 1 | $178,000 | 1.014 | $175,542 | -$385,030 |
| 2 | $186,900 | 1.014 | $184,320 | -$200,710 |
| 3 | $196,245 | 1.033 | $189,976 | -$10,734 |
| 4 | $206,057 | 1.053 | $195,686 | $184,952 |
NPV After 4 Years: -$560,572 + ($175,542 + $184,320 + $189,976 + $195,686) = $184,952
Break-Even: Year 4
Average Case – Technology (Lower Pre-MBA Salary, Lower Opportunity Cost)
Year | Post-MBA Salary | Discount Factor | Present Value | Cumulative NPV |
| Pre-MBA Salary (Year 0) | Total Cost = Program Expenses (2 years) | Opportunity Cost (2 years forgone pre-MBA salary, 5% growth Yr2) | Sum(Total Cost, Opportunity Cost) (Year 0) | |
| Year 0 | $120,000 | $253,072 | $246,000 | -$499,072 |
| 1 | $178,000 | 1.014 | $175,542 | -$323,530 |
| 2 | $186,900 | 1.014 | $184,320 | -$139,210 |
| 3 | $196,245 | 1.033 | $189,976 | $50,766 |
Average Case – NPV After 3 Years: -$499,072 + ($175,542 + $184,320 + $189,976) = $50,766
Average Case – Break-Even: Year 3
Harvard MBA - Private Equity Industry (Median Base Salary) (ROI Calculation)(Harvard MBA Cost vs. Salary)
Highest Paid Case (Original Pre-MBA Salary Assumption)
Year | Post-MBA Salary | Discount Factor | Present Value | Cumulative NPV |
| Pre-MBA Salary (Year 0) | Total Cost = Program Expenses (2 years) | Opportunity Cost (2 years forgone pre-MBA salary, 5% growth Yr2) | Sum(Total Cost, Opportunity Cost) (Year 0) | |
| Year 0 | $155,000 | $253,072 | $317,750 | -$570,822 |
| 1 | $187,500 | 1.014 | $184,911 | -$385,911 |
| 2 | $196,875 | 1.014 | $194,157 | -$191,754 |
| 3 | $206,719 | 1.033 | $200,115 | $8,361 |
NPV After 3 Years: -$570,822 + ($184,911 + $194,157 + $200,115) = $8,361
Break-Even: Year 3
Average Case – Private Equity (Lower Pre-MBA Salary, Lower Opportunity Cost)
Year | Post-MBA Salary | Discount Factor | Present Value | Cumulative NPV |
| Pre-MBA Salary (Year 0) | Total Cost = Program Expenses (2 years) | Opportunity Cost (2 years forgone pre-MBA salary, 5% growth Yr2) | Sum(Total Cost, Opportunity Cost) (Year 0) | |
| Year 0 | $150,000 | $253,072 | $307,500 | -$560,572 |
| 1 | $187,500 | 1.014 | $184,911 | -$375,661 |
| 2 | $196,875 | 1.014 | $194,157 | -$181,504 |
| 3 | $206,719 | 1.033 | $200,115 | $18,611 |
Average Case – NPV After 3 Years: -$560,572 + ($184,911 + $194,157 + $200,115) = $18,611
Average Case – Break-Even: Year 3
Harvard MBA - Investment Management/Hedge Fund (Median Base Salary) (ROI Calculation)(Harvard MBA Cost vs. Salary)
Highest Paid Case (Original Pre-MBA Salary Assumption)
Year | Post-MBA Salary | Discount Factor | Present Value | Cumulative NPV |
| Pre-MBA Salary (Year 0) | Total Cost = Program Expenses (2 years) | Opportunity Cost (2 years forgone pre-MBA salary, 5% growth Yr2) | Sum(Total Cost, Opportunity Cost) (Year 0) | |
| Year 0 | $200,000 | $253,072 | $410,000 | -$663,072 |
| 1 | $182,500 | 1.014 | $179,980 | -$483,092 |
| 2 | $191,625 | 1.014 | $188,979 | -$294,113 |
| 3 | $201,206 | 1.033 | $194,778 | -$99,335 |
| 4 | $211,267 | 1.053 | $200,633 | $101,298 |
NPV After 4 Years: -$663,072 + ($179,980 + $188,979 + $194,778 + $200,633) = $101,298
Break-Even: Year 4
Average Case – Investment Management (Lower Pre-MBA Salary, Lower Opportunity Cost)
Year | Post-MBA Salary | Discount Factor | Present Value | Cumulative NPV |
| Pre-MBA Salary (Year 0) | Total Cost = Program Expenses (2 years) | Opportunity Cost (2 years forgone pre-MBA salary, 5% growth Yr2) | Sum(Total Cost, Opportunity Cost) (Year 0) | |
| Year 0 | $140,000 | $253,072 | $287,000 | -$540,072 |
| 1 | $182,500 | 1.014 | $179,980 | -$360,092 |
| 2 | $191,625 | 1.014 | $188,979 | -$171,113 |
| 3 | $201,206 | 1.033 | $194,778 | $23,665 |
Average Case – NPV After 3 Years: -$540,072 + ($179,980 + $188,979 + $194,778) = $23,665
Average Case – Break-Even: Year 3
Harvard MBA - Healthcare Industry (Median Base Salary) (ROI Calculation)(Harvard MBA Cost vs. Salary)
Highest Paid Case (Original Pre-MBA Salary Assumption)
Year | Post-MBA Salary | Discount Factor | Present Value | Cumulative NPV |
| Pre-MBA Salary (Year 0) | Total Cost = Program Expenses (2 years) | Opportunity Cost (2 years forgone pre-MBA salary, 5% growth Yr2) | Sum(Total Cost, Opportunity Cost) (Year 0) | |
| Year 0 | $150,000 | $253,072 | $307,500 | -$560,572 |
| 1 | $160,000 | 1.014 | $157,791 | -$402,781 |
| 2 | $168,000 | 1.014 | $165,680 | -$237,101 |
| 3 | $176,400 | 1.033 | $170,765 | -$66,336 |
| 4 | $185,220 | 1.053 | $175,897 | $109,561 |
NPV After 4 Years: -$560,572 + ($157,791 + $165,680 + $170,765 + $175,897) = $109,561
Break-Even: Year 4
Average Case – Healthcare (Lower Pre-MBA Salary, Lower Opportunity Cost)
Year | Post-MBA Salary | Discount Factor | Present Value | Cumulative NPV |
| Pre-MBA Salary (Year 0) | Total Cost = Program Expenses (2 years) | Opportunity Cost (2 years forgone pre-MBA salary, 5% growth Yr2) | Sum(Total Cost, Opportunity Cost) (Year 0) | |
| Year 0 | $115,000 | $253,072 | $235,750 | -$488,822 |
| 1 | $160,000 | 1.014 | $157,791 | -$331,031 |
| 2 | $168,000 | 1.014 | $165,680 | -$165,351 |
| 3 | $176,400 | 1.033 | $170,765 | $5,414 |
Average Case – NPV After 3 Years: -$488,822 + ($157,791 + $165,680 + $170,765) = $5,414
Average Case – Break-Even: Year 3
Harvard MBA - Investment Banking Industry (Median Base Salary) (ROI Calculation)(Harvard MBA Cost vs. Salary)
Highest Paid Case (Original Pre-MBA Salary Assumption)
Year | Post-MBA Salary | Discount Factor | Present Value | Cumulative NPV |
| Pre-MBA Salary (Year 0) | Total Cost = Program Expenses (2 years) | Opportunity Cost (2 years forgone pre-MBA salary, 5% growth Yr2) | Sum(Total Cost, Opportunity Cost) (Year 0) | |
| Year 0 | $150,000 | $253,072 | $307,500 | -$560,572 |
| 1 | $175,000 | 1.014 | $172,584 | -$387,988 |
| 2 | $183,750 | 1.014 | $181,213 | -$206,775 |
| 3 | $192,938 | 1.033 | $186,774 | -$20,001 |
| 4 | $202,584 | 1.053 | $192,387 | $172,386 |
NPV After 4 Years: -$560,572 + ($172,584 + $181,213 + $186,774 + $192,387) = $172,386
Break-Even: Year 4
Average Case – Investment Banking (Lower Pre-MBA Salary, Lower Opportunity Cost)
Year | Post-MBA Salary | Discount Factor | Present Value | Cumulative NPV |
| Pre-MBA Salary (Year 0) | Total Cost = Program Expenses (2 years) | Opportunity Cost (2 years forgone pre-MBA salary, 5% growth Yr2) | Sum(Total Cost, Opportunity Cost) (Year 0) | |
| Year 0 | $110,000 | $253,072 | $225,500 | -$478,572 |
| 1 | $175,000 | 1.014 | $172,584 | -$305,988 |
| 2 | $183,750 | 1.014 | $181,213 | -$124,775 |
| 3 | $192,938 | 1.033 | $186,774 | $61,999 |
Average Case – NPV After 3 Years: -$478,572 + ($172,584 + $181,213 + $186,774) = $61,999
Average Case – Break-Even: Year 3
Harvard MBA - Manufacturing Industry (Median Base Salary) (ROI Calculation)(Harvard MBA Cost vs. Salary)
Highest Paid Case (Original Pre-MBA Salary Assumption)
Year | Post-MBA Salary | Discount Factor | Present Value | Cumulative NPV |
| Pre-MBA Salary (Year 0) | Total Cost = Program Expenses (2 years) | Opportunity Cost (2 years forgone pre-MBA salary, 5% growth Yr2) | Sum(Total Cost, Opportunity Cost) (Year 0) | |
| Year 0 | $140,000 | $253,072 | $287,000 | -$540,072 |
| 1 | $162,000 | 1.014 | $159,763 | -$380,309 |
| 2 | $170,100 | 1.014 | $167,751 | -$212,558 |
| 3 | $178,605 | 1.033 | $172,899 | -$39,659 |
| 4 | $187,535 | 1.053 | $178,096 | $138,437 |
NPV After 4 Years: -$540,072 + ($159,763 + $167,751 + $172,899 + $178,096) = $138,437
Break-Even: Year 4
Average Case – Manufacturing (Lower Pre-MBA Salary, Lower Opportunity Cost)
Year | Post-MBA Salary | Discount Factor | Present Value | Cumulative NPV |
| Pre-MBA Salary (Year 0) | Total Cost = Program Expenses (2 years) | Opportunity Cost (2 years forgone pre-MBA salary, 5% growth Yr2) | Sum(Total Cost, Opportunity Cost) (Year 0) | |
| Year 0 | $100,000 | $253,072 | $205,000 | -$458,072 |
| 1 | $162,000 | 1.014 | $159,763 | -$298,309 |
| 2 | $170,100 | 1.014 | $167,751 | -$130,558 |
| 3 | $178,605 | 1.033 | $172,899 | $42,341 |
Average Case – NPV After 3 Years: -$458,072 + ($159,763 + $167,751 + $172,899) = $42,341
Average Case – Break-Even: Year 3
Harvard MBA - Non-Profit/Government Industry (Median Base Salary) (ROI Calculation)(Harvard MBA Cost vs. Salary)
Highest Paid Case (Original Pre-MBA Salary Assumption)
Year | Post-MBA Salary | Discount Factor | Present Value | Cumulative NPV |
| Pre-MBA Salary (Year 0) | Total Cost = Program Expenses (2 years) | Opportunity Cost (2 years forgone pre-MBA salary, 5% growth Yr2) | Sum(Total Cost, Opportunity Cost) (Year 0) | |
| Year 0 | $110,000 | $253,072 | $225,500 | -$478,572 |
| 1 | $130,000 | 1.014 | $128,205 | -$350,367 |
| 2 | $136,500 | 1.014 | $134,615 | -$215,752 |
| 3 | $143,325 | 1.033 | $138,746 | -$77,006 |
| 4 | $150,491 | 1.053 | $142,916 | $65,910 |
NPV After 4 Years: -$478,572 + ($128,205 + $134,615 + $138,746 + $142,916) = $65,910
Break-Even: Year 4
Average Case – Non-Profit (Lower Pre-MBA Salary, Lower Opportunity Cost)
Year | Post-MBA Salary | Discount Factor | Present Value | Cumulative NPV |
| Pre-MBA Salary (Year 0) | Total Cost = Program Expenses (2 years) | Opportunity Cost (2 years forgone pre-MBA salary, 5% growth Yr2) | Sum(Total Cost, Opportunity Cost) (Year 0) | |
| Year 0 | $88,000 | $253,072 | $180,400 | -$433,472 |
| 1 | $130,000 | 1.014 | $128,205 | -$305,267 |
| 2 | $136,500 | 1.014 | $134,615 | -$170,652 |
| 3 | $143,325 | 1.033 | $138,746 | -$31,906 |
| 4 | $150,491 | 1.053 | $142,916 | $111,010 |
Average Case – NPV After 4 Years: -$433,472 + ($128,205 + $134,615 + $138,746 + $142,916) = $111,010
Average Case – Break-Even: Year 4
Harvard MBA - Venture Capital Industry (Median Base Salary) (ROI Calculation)(Harvard MBA Cost vs. Salary)
Highest Paid Case (Original Pre-MBA Salary Assumption)
Year | Post-MBA Salary | Discount Factor | Present Value | Cumulative NPV |
| Pre-MBA Salary (Year 0) | Total Cost = Program Expenses (2 years) | Opportunity Cost (2 years forgone pre-MBA salary, 5% growth Yr2) | Sum(Total Cost, Opportunity Cost) (Year 0) | |
| Year 0 | $150,000 | $253,072 | $307,500 | -$560,572 |
| 1 | $200,000 | 1.014 | $197,239 | -$363,333 |
| 2 | $210,000 | 1.014 | $207,101 | -$156,232 |
| 3 | $220,500 | 1.033 | $213,456 | $57,224 |
NPV After 3 Years: -$560,572 + ($197,239 + $207,101 + $213,456) = $57,224
Break-Even: Year 3
Average Case – Venture Capital (Lower Pre-MBA Salary, Lower Opportunity Cost)
Year | Post-MBA Salary | Discount Factor | Present Value | Cumulative NPV |
| Pre-MBA Salary (Year 0) | Total Cost = Program Expenses (2 years) | Opportunity Cost (2 years forgone pre-MBA salary, 5% growth Yr2) | Sum(Total Cost, Opportunity Cost) (Year 0) | |
| Year 0 | $110,000 | $253,072 | $225,500 | -$478,572 |
| 1 | $200,000 | 1.014 | $197,239 | -$281,333 |
| 2 | $210,000 | 1.014 | $207,101 | -$74,232 |
| 3 | $220,500 | 1.033 | $213,456 | $139,224 |
Average Case – NPV After 3 Years: -$478,572 + ($197,239 + $207,101 + $213,456) = $139,224
Average Case – Break-Even: Year 3
Harvard MBA - Consumer Products Industry (Median Base Salary) (ROI Calculation)(Harvard MBA Cost vs. Salary)
Highest Paid Case (Original Pre-MBA Salary Assumption)
Year | Post-MBA Salary | Discount Factor | Present Value | Cumulative NPV |
| Pre-MBA Salary (Year 0) | Total Cost = Program Expenses (2 years) | Opportunity Cost (2 years forgone pre-MBA salary, 5% growth Yr2) | Sum(Total Cost, Opportunity Cost) (Year 0) | |
| Year 0 | $140,000 | $253,072 | $287,000 | -$540,072 |
| 1 | $146,250 | 1.014 | $144,231 | -$395,841 |
| 2 | $153,562 | 1.014 | $151,442 | -$244,399 |
| 3 | $161,241 | 1.033 | $156,090 | -$88,309 |
| 4 | $169,303 | 1.053 | $160,782 | $72,473 |
NPV After 4 Years: -$540,072 + ($144,231 + $151,442 + $156,090 + $160,782) = $72,473
Break-Even: Year 4
Average Case – Consumer Products (Lower Pre-MBA Salary, Lower Opportunity Cost)
Year | Post-MBA Salary | Discount Factor | Present Value | Cumulative NPV |
| Pre-MBA Salary (Year 0) | Total Cost = Program Expenses (2 years) | Opportunity Cost (2 years forgone pre-MBA salary, 5% growth Yr2) | Sum(Total Cost, Opportunity Cost) (Year 0) | |
| Year 0 | $95,000 | $253,072 | $194,750 | -$447,822 |
| 1 | $146,250 | 1.014 | $144,231 | -$303,591 |
| 2 | $153,562 | 1.014 | $151,442 | -$152,149 |
| 3 | $161,241 | 1.033 | $156,090 | $3,941 |
Average Case – NPV After 3 Years: -$447,822 + ($144,231 + $151,442 + $156,090) = $3,941
Average Case – Break-Even: Year 3
Harvard MBA - Entertainment/Media Industry (Median Base Salary) (ROI Calculation)(Harvard MBA Cost vs. Salary)
Highest Paid Case (Original Pre-MBA Salary Assumption)
Year | Post-MBA Salary | Discount Factor | Present Value | Cumulative NPV |
| Pre-MBA Salary (Year 0) | Total Cost = Program Expenses (2 years) | Opportunity Cost (2 years forgone pre-MBA salary, 5% growth Yr2) | Sum(Total Cost, Opportunity Cost) (Year 0) | |
| Year 0 | $120,000 | $253,072 | $246,000 | -$499,072 |
| 1 | $180,000 | 1.014 | $177,515 | -$321,557 |
| 2 | $189,000 | 1.014 | $186,391 | -$135,166 |
| 3 | $198,450 | 1.033 | $192,110 | $56,944 |
NPV After 3 Years: -$499,072 + ($177,515 + $186,391 + $192,110) = $56,944
Break-Even: Year 3
Average Case – Entertainment (Lower Pre-MBA Salary, Lower Opportunity Cost)
Year | Post-MBA Salary | Discount Factor | Present Value | Cumulative NPV |
| Pre-MBA Salary (Year 0) | Total Cost = Program Expenses (2 years) | Opportunity Cost (2 years forgone pre-MBA salary, 5% growth Yr2) | Sum(Total Cost, Opportunity Cost) (Year 0) | |
| Year 0 | $90,000 | $253,072 | $184,500 | -$437,572 |
| 1 | $180,000 | 1.014 | $177,515 | -$260,057 |
| 2 | $189,000 | 1.014 | $186,391 | -$73,666 |
| 3 | $198,450 | 1.033 | $192,110 | $118,444 |
Average Case – NPV After 3 Years: -$437,572 + ($177,515 + $186,391 + $192,110) = $118,444
Average Case – Break-Even: Year 3
Factors Affecting Harvard Business School ROI Analysis
1) IMPACT of Pre-MBA Industry on ROI (Both Cases)
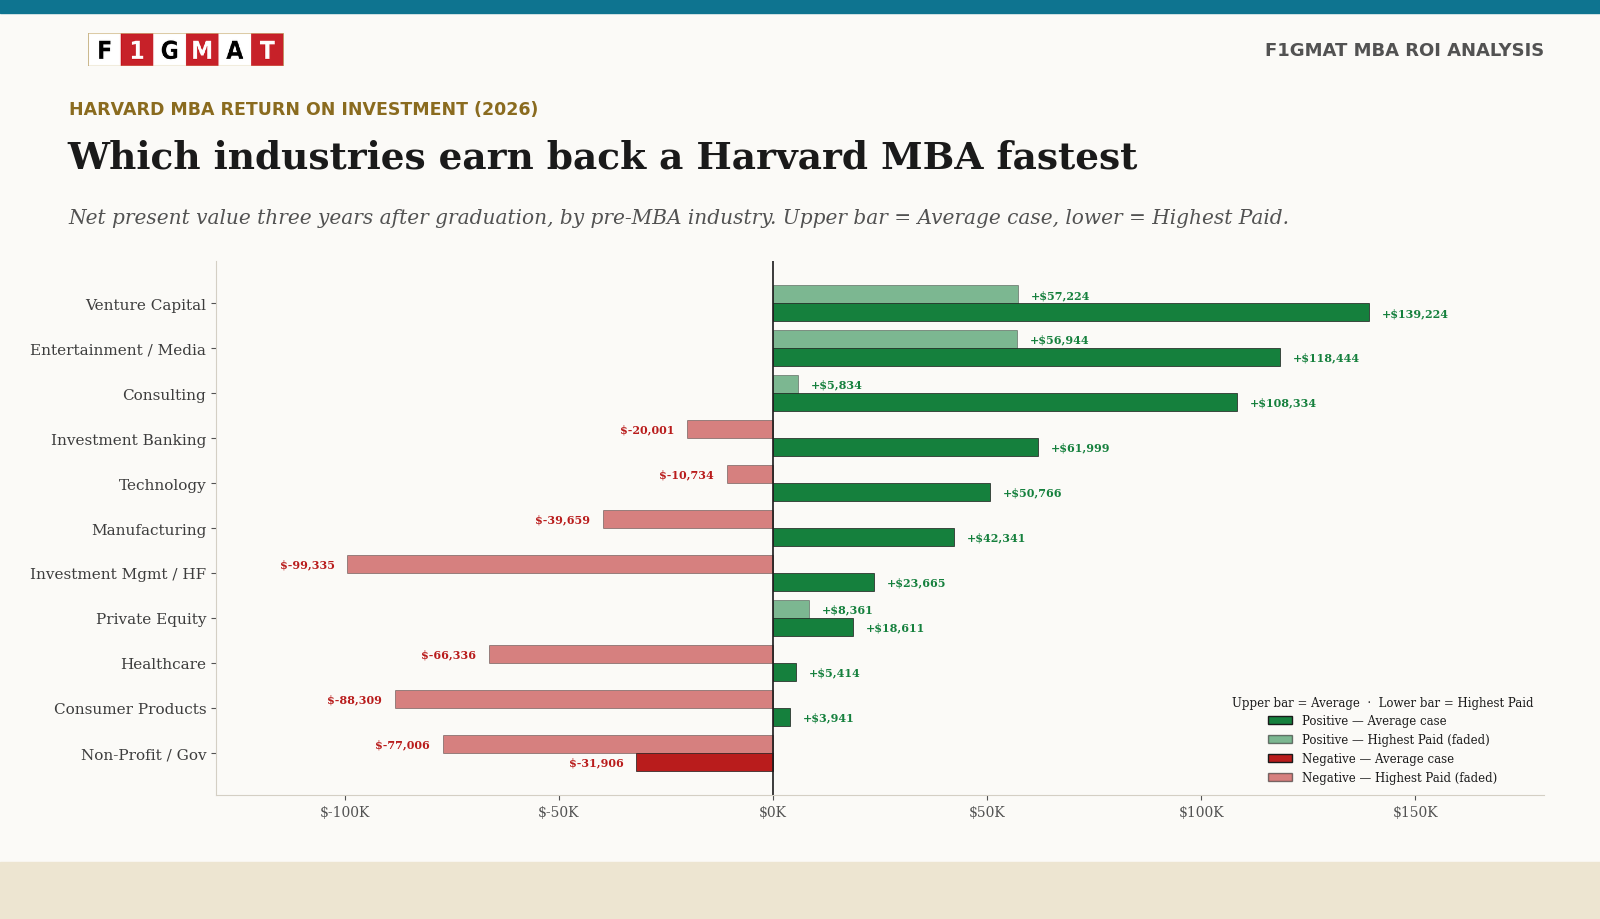
| Rank | Pre-MBA Industry | Pre-MBA (Highest Paid) | Pre-MBA (Average) | Post-MBA Salary | Break-Even (Highest) | Break-Even (Average) | NPV Yr3 (Highest) | NPV Yr3 (Average) |
|---|---|---|---|---|---|---|---|---|
| 1 | Venture Capital | $150,000 | $110,000 | $200,000 | Year 3 | Year 3 | $57,224 | $139,224 |
| 2 | Entertainment/Media | $120,000 | $90,000 | $180,000 | Year 3 | Year 3 | $56,944 | $118,444 |
| 3 | Consulting | $160,000 | $110,000 | $190,000 | Year 3 | Year 3 | $5,834 | $108,334 |
| 4 | Private Equity | $155,000 | $150,000 | $187,500 | Year 3 | Year 3 | $8,361 | $18,611 |
| 5 | Technology | $150,000 | $120,000 | $178,000 | Year 4 | Year 3 | -$10,734 | $50,766 |
| 6 | Investment Banking | $150,000 | $110,000 | $175,000 | Year 4 | Year 3 | -$20,001 | $61,999 |
| 7 | Investment Management/Hedge Fund | $200,000 | $140,000 | $182,500 | Year 4 | Year 3 | -$99,335 | $23,665 |
| 8 | Healthcare | $150,000 | $115,000 | $160,000 | Year 4 | Year 3 | -$66,336 | $5,414 |
| 9 | Manufacturing | $140,000 | $100,000 | $162,000 | Year 4 | Year 3 | -$39,659 | $42,341 |
| 10 | Consumer Products | $140,000 | $95,000 | $146,250 | Year 4 | Year 3 | -$88,309 | $3,941 |
| 11 | Non-Profit/Government | $110,000 | $88,000 | $130,000 | Year 4 | Year 4 | -$77,006 | -$31,906 |
For example, a candidate from non-profit or government sees a substantial salary increase post-MBA. The immediate post-MBA salary and the forgone pre-MBA salary together determine the total return.
Pre-MBA salary and post-MBA salary trends for the industry together determine the opportunity cost.
Entertainment and Media: Outlier Industry for Harvard MBA
Entertainment and Media was the outlier industry for Harvard. The industry has one of the lowest pre-MBA salaries, but because Harvard placed candidates into the industry with a $180,000 median salary, the ROI is one of the highest for candidates from the industry. This can only occur because of Harvard's Unique MBA Curriculum.
Finance: High ROI for Harvard MBA
The high ROI was consistent across all Finance sub-sectors: Venture Capital, Private Equity and Investment Banking, all ranking in the top of the list, with Venture Capital ROI an outlier for Harvard MBA. The industry attracted the highest post-MBA median salary.
For Harvard MBA: High Pre-MBA Salary Affects Opportunity Cost
Industries with higher pre-MBA salary and moderate post-MBA salary take longer to realize their return, because opportunity cost is higher. Under the Highest Paid case, Technology, Investment Banking, Investment Management/Hedge Fund, Healthcare and Manufacturing reach ROI only in Year 4; under the Average case, all of them reach it in Year 3.
2) Entrepreneurship Trend
17% of the Class of 2025 started businesses. There are no guarantees of entrepreneurs beating salaried professionals in ROI. Approximately 20–21% fail in the first year, 49–50% fail within 5 years and 65% fail within 10 years according to the U.S. Bureau of Labor Statistics. For tech, SaaS, and venture-backed startups, the failure rate reaches 90% within 10 years.
3) Location’s Impact
92% stayed in the US, with higher salaries in the Northeast ($185,000 median) vs. international roles.
4) Regional Differences
Regional differences in median base salary are defined by legacy industry in the region (Technology in San Francisco, Energy in Texas, Manufacturing in Chicago).
For Harvard MBA, regardless of US region, the median base salary by location is between $180,000 and $190,000.
5) Economic Outlook
With real rates stabilizing and GDP growth at 2.4% in 2026, steady salary growth is likely.
6) Tips to Maximize ROI
Negotiate higher starting salaries (the HBS network helps; pre-MBA industry, undergraduate degree, and network reach matter), pursue high-growth industries, and apply for need-based aid.
Methodology: How We Estimated Pre-MBA Salary
Opportunity cost is the largest single component of an MBA's true cost, and it depends entirely on what a candidate earned before enrolling. Harvard does not publish pre-MBA salary by prior industry, so any figure is an estimate. We report two.
The Highest Paid case
These are the figures used in earlier versions of this analysis, $150,000 to $200,000 across most industries. They sit close to post-MBA salary levels and are best read as pre-MBA total compensation (base plus bonus) for top-of-market candidates, or as a deliberately conservative upper bound on opportunity cost. A higher assumed pre-MBA salary raises opportunity cost and lengthens the modeled payback, so this case is the cautious one.
The Average case
These are base salaries triangulated from four independent sources, cross-checked against each other:
- Compensation surveys (levels.fyi[5], Wall Street Prep[6], Mergers & Inquisitions[7],for role-level base pay at the seniority of an incoming Harvard student, typically three to five years of experience.
- U.S. Bureau of Labor Statistics median wages (May 2024 Occupational Employment and Wage Statistics)[4],as an economy-wide floor. BLS medians understate top-firm, major-metro pay, so they bound the estimate from below rather than setting it.
- H-1B Labor Condition Application disclosures, which report verified base salaries for visa-sponsored hires at named firms.
- Self-reported pre-MBA pay from candidates on Reddit, Blind, and verified school salary diaries, which cluster in the $80,000 to $110,000 band and confirm the survey figures rather than the higher assumption.
A fifth cross-check is the salary jump each figure implies. The Financial Times 2026 ranking[8], reports a 112 percent aggregate post-MBA salary increase for Harvard. The Average figures imply per-industry jumps of 25 to 82 percent (Private Equity smallest, since it already pays well pre-MBA; Venture Capital and Consulting largest), which is consistent with how MBA salary gains distribute. The Highest Paid figures imply jumps of 7 to 33 percent, which is implausibly small for a degree that delivers a doubling in aggregate.
Seven of the eleven Average figures are directly sourced as above. Four (Investment Management/Hedge Fund, Manufacturing, Consumer Products, Entertainment/Media) are estimated by analogy to adjacent roles and are marked as such in the table.
Pre-MBA base salary by industry, both cases
| Pre-MBA Industry | Average Base | Highest Paid | Basis for Average figure |
|---|---|---|---|
| Consulting | $110,000 | $160,000 | MBB Business Analyst/Associate base ~$110-112K (Case Interview Hub, MBB 2026 guide); BLS management analyst median $101,190 |
| Investment Banking | $110,000 | $150,000 | First-year analyst base $110K, the bulge-bracket floor after Goldman's $85K to $110K raise (Wall Street Prep, IB comp guides) |
| Venture Capital | $110,000 | $150,000 | Pre-MBA associate base, wide $70-200K range, midpoint ~$110K (Mergers & Inquisitions, Growth Equity guides) |
| Private Equity | $150,000 | $155,000 | Pre-MBA associate base $140-175K, midpoint $150K (Wall Street Prep 2025) |
| Technology | $120,000 | $150,000 | Product/strategy base $120-130K (levels.fyi, Payscale 2026); real user reports $110K pre-MBA into Google |
| Healthcare | $115,000 | $150,000 | BLS medical and health services manager median $117,960 (May 2024); early-career PM $100K |
| Non-Profit/Government | $88,000 | $110,000 | BLS budget analyst $96,370, government management analyst $101K; nonprofit roles lower; Scheller verified case $90K |
| Investment Management/Hedge Fund | $140,000 | $200,000 | Estimate by analogy to finance analyst roles; base typically $125-150K pre-MBA |
| Manufacturing | $100,000 | $140,000 | Estimate by analogy to engineering/operations roles, $95-110K base |
| Consumer Products | $95,000 | $140,000 | Estimate by analogy to brand/marketing associate roles, $90-100K base |
| Entertainment/Media | $90,000 | $120,000 | Estimate by analogy, one of the lower-paying pre-MBA fields, $85-95K base |
The aggregate calculation uses a $115,000 Average pre-MBA base, a representative blend weighted toward the consulting, technology, and finance roles that dominate Harvard placements.
Using base salary over the total compensation, we have kept the opportunity-cost figure conservative and consistent with how Harvard reports post-MBA pay (base, with bonuses listed separately).
Harvard MBA Investment Return (2026)
Is Harvard MBA Worth it?
For most, yes. See Harvard MBA Essay Tips and Harvard MBA Essay Examples.
The NPV turns positive within Year 3 under the Average case and early Year 4 under the Highest Paid case, and the degree's prestige unlocks doors to top firms like McKinsey, Google, and Goldman Sachs. However, if your pre-MBA salary is low or you're debt-averse, consider scholarships or peer schools.
Weigh your career goals against an investment of roughly $433,000 to $663,000 (two-year total cost plus two years of opportunity cost, depending on industry and case).
For high-achievers in consulting or finance, the payoff is clear.
Ready to apply? Explore F1GMAT’s Harvard MBA Essay Guide or Contact Atul Jose for Career Planning
Key Takeaways
The Harvard MBA return on investment question has no single answer. It depends on what you earned before enrolling and the industry you target after. Here are the key takeaways:
1. Opportunity cost, not tuition, drives the math
Two years of forgone salary ($235,750 in the Average case, $328,000 in the Highest Paid case) is comparable to or larger than the $253,072 program cost. This is why a candidate's pre-MBA salary moves the break-even year more than any scholarship.
2. Lower pre-MBA pay means faster payback
Counterintuitively, an Average-case candidate (lower pre-MBA base) recovers the investment sooner than a Highest Paid candidate, because the forgone salary is smaller. Ten of eleven industries break even by Year 3 in the Average case versus four in the Highest Paid case.
3. Industry of placement decides the winners
Venture Capital (+$139,224 Average, +$57,224 Highest Paid at Year 3), Entertainment/Media, and Consulting deliver the fastest returns because Harvard places candidates into high-paying post-MBA roles regardless of where they started.
4. Investment Management is the cautionary case
It is the one industry where median pay can fall after the MBA (from a $200,000 Highest Paid pre-MBA base to a $182,500 post-MBA median), which is why it has the longest payback in the Highest Paid case (negative $99,335 at Year 3).
5. Non-Profit/Government is the only Year 4 outlier
Under both cases it is the single industry that does not break even by Year 3 (negative $31,906 Average, negative $77,006 Highest Paid at Year 3), turning positive in Year 4.
6. Bonuses and scholarships only improve these numbers
The model uses base salary only and ignores the median $30,000 signing bonus and $46,000 performance bonus. Need-based scholarships (about 50% of students, roughly $100,000 over two years) cut the investment further. Both shorten payback beyond what the tables show.
FAQ
1) What is the ROI of a Harvard MBA?
Using a net present value model on the Class of 2025, the investment turns positive within Year 3 under the Average pre-MBA salary case and in early Year 4 under the Highest Paid case. Ten of eleven pre-MBA industries break even by Year 3 in the Average case; four do in the Highest Paid case. Venture Capital, Entertainment/Media, and Consulting show the fastest returns.
2) How long does it take to break even on a Harvard MBA?
Most industries break even three to four years after graduation. Under the Average case, ten of eleven industries recover the full investment by the end of Year 3, with only Non-Profit/Government reaching break-even in Year 4. Under the Highest Paid case, Venture Capital, Entertainment/Media, Consulting and Private Equity break even by Year 3 and the rest by Year 4.
3) Why do you show two pre-MBA salary cases?
Harvard does not publish pre-MBA salary by prior industry, so any figure is an estimate. The Highest Paid case uses top-of-market figures ($110,000 to $200,000), best read as total compensation or a conservative upper bound on opportunity cost. The Average case uses base salaries triangulated from compensation surveys, U.S. Bureau of Labor Statistics data, H-1B disclosures, and self-reported pay ($88,000 to $150,000). Showing both lets you see the full range.
4) Which pre-MBA industry has the best Harvard MBA ROI?
Venture Capital has the strongest three-year NPV in both cases (+$139,224 Average, +$57,224 Highest Paid), followed by Entertainment/Media and Consulting. These industries combine a moderate pre-MBA salary with a high post-MBA placement, so the salary jump is largest.
5) Which industry takes longest to pay back?
Non-Profit/Government is the only industry that does not break even by Year 3 under either case (negative $31,906 Average, negative $77,006 Highest Paid at Year 3), turning positive in Year 4. Under the Highest Paid case, Investment Management/Hedge Fund has the deepest Year 3 position (negative $99,335) because its $200,000 pre-MBA salary raises opportunity cost.
6) Does the analysis include bonuses?
No. The NPV model uses base salary only, a deliberately conservative choice. The Class of 2025 median signing bonus was $30,000 (received by 58%) and the median performance bonus was $46,000 (received by 67%). Adding these would shorten every payback period beyond what the tables show.
7) How do scholarships change Harvard MBA ROI?
About 50% of students receive need-based scholarships averaging roughly $100,000 over two years (Harvard awards no merit aid). A scholarship of that size cuts the program cost by up to $100,000, moving break-even earlier in every industry. Scholarships are not included in the base NPV tables.
References
- Harvard Business School, Annual Cost of Attendance (MBA), 2025-2026 ↩
- Harvard Business School, MBA Employment Statistics / Data & Statistics, Class of 2025 ↩
- Harvard Business School, Financial Aid (need-based scholarships, ~50% of students, ~$100,000 over two years) ↩
- U.S. Bureau of Labor Statistics, Occupational Employment and Wage Statistics (OEWS), May 2024 ↩
- levels.fyi, compensation data for technology and product roles ↩
- Wall Street Prep, investment banking and private equity analyst compensation guides ↩
- Mergers & Inquisitions, private equity and venture capital pre-MBA associate compensation ↩
- Financial Times, Global MBA Ranking 2026 (aggregate salary increase) ↩

