Quadratic Inequalities is an important and often misunderstood topic in GMAT. But before we start, let us recall what a quadratic equation is and how is it represented.
The standard form of a quadratic equation is:
And the roots of this standard equation are: 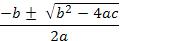
where b2 - 4ac is known as a Discriminant, ?.
This standard quadratic equation becomes an inequality if it is represented as  (or > 0)
The first step in solving a quadratic inequality problem is to convert the equation into the standard equation format (if it is not given in the standard form) making zero on the right hand side.
The objective of solving any inequality for ‘x’ is to look for those values of ‘x’ which will make the inequality true. These are known as the solutions to inequality and are usually represented in terms of intervals. While solving the quadratic equation, the roots are denoted as ‘x1’ and ‘x2’ which are real when the equation f(x) = 0.
The notation for an open interval is (x1, x2) and for closed intervals is [x1, x2]. The closed intervals include the end-points in the solutions while the open intervals don’t. Similarly, half closed intervals mean (-?, x1] and [x2, + ?).
Let’s look at a sample problem:
Step 1: this equation is not given in the standard form, so let’s convert the right hand side so that the equation will be in the standard form.
Step 2: Factoring the equation
Step 3: Find the intervals which satisfy the given condition.
Thus we see that x < 4 and x > 5 are possible solutions.
The method we have just discussed is commonly known as the ‘algebraic method’. Other methods used for solving quadratic inequalities are – the number line method and graphical method.
The number line method involves drawing the boundaries on the line and creating the intervals for investigation. Then pick a number from each interval and test it for the original inequality. If the result happens to be true then that interval is a solution to the inequality.
The two real roots x1 and x2, as obtained from Step 3 of the algebraic approach as discussed in the above example, are plotted on the number line. Then the number line is divided into one segment and 2 rays.
Remember to keep the origin 0 as the test point.
Next substitute x = 0 in the quadratic inequality equation (converted into the standard form). In case the inequality is true then existence of the origin lay on the true segment. Hypothetically, if one segment is found to be a part of the solutions, then other segment would automatically be a part of the solutions owing to symmetric property of the parabolic curve.
The graphical method involves drawing curves. Since the equations can also be represented as graphs, then depending on the type of inequality we have to choose the corresponding area. For an < 0 type of inequality the area lying below the x-axis is to be considered and vice-versa.
Thus, when the parabolic curve for f(x) lies above the x-axis, then the inequality is positive. The opposite is also true. Aspirants should note that there is no need to draw the parabola accurately but the rough sketch should be good enough to give an idea of two roots.
But care must be taken to accurately set the bent of parabola, i.e., upward or downward. There is one particular advantage of this method. It can be used to solve two or three quadratic inequalities by graphing two or three parabolas on the same coordinates.
Finally let us discuss some quick tips:
1. Time is always the biggest enemy in the exams so it’s most essential that problems should be solved as fast as possible. Moreover, applicants must also understand that many times a problem can be solved quickly by applying the method most suitable to the problem at hand. Some problems require an algebraic solution, while some are easier to solve by graphs. So applying the right method is very essential.
2. For multiple choice questions, it has been observed that substituting the most probable answers into the quadratic equation, or applying the algebraic method lead to the fastest results. The drawing of a graph or the number-line methods require more time.
 About the Author
I am Atul Jose, Founding Consultant of F1GMAT, an MBA admissions consultancy that has worked with applicants since 2009.
For the past 15 years I have edited the application files of admits to the M7 programs: Harvard Business School, Stanford Graduate School of Business, the Wharton School, MIT Sloan, Chicago Booth, Kellogg School of Management, and Columbia Business School, together with admits to Berkeley Haas, Yale School of Management, NYU Stern, Michigan Ross, Duke Fuqua, Darden, Tuck, IMD, London Business School, INSEAD, SDA Bocconi, IESE Business School, HEC Paris, McCombs, and Tepper, plus other programs inside the global top 30.
My work covers the full MBA application deliverable: career planning and profile evaluation, application essay editing, recommendation letter editing, mock interviews and interview preparation, scholarship and fellowship essay editing, and cover letter editing for funding applications. Full bio with credentials and admit history is here.
I am the author of the Winning MBA Essay Guide, the best-selling essay guide covering M7 MBA programs. I have written and updated the guide annually since 2013, which makes the 2026 edition the thirteenth.
The reason I still write and edit essays every cycle: a good MBA essay carries a real applicant's voice. Writing essays for F1GMAT's Books and Editing essays weekly is how I stay calibrated to what current admissions committees respond to.
Contact me for school selection, career planning, essay strategy, narrative development, essay editing, interview preparation, scholarship essay editing, or guidance documents for recommendation letters.